


A stock market on edge
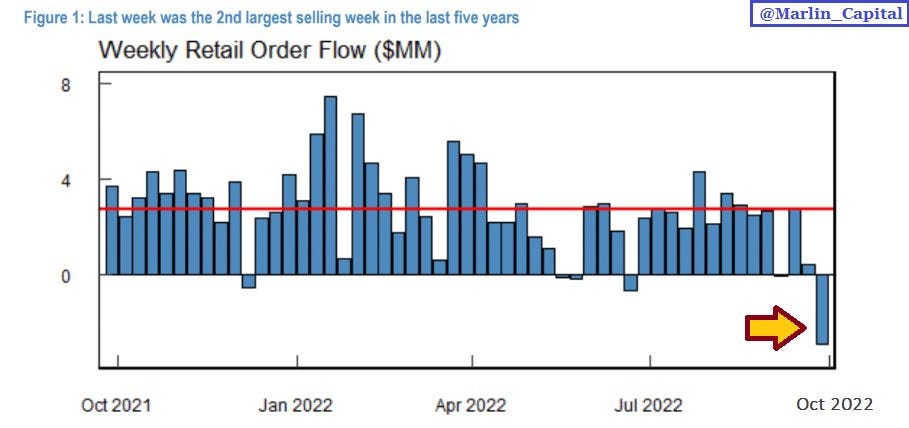
Retail participants throw in the towel

Perspective into Year End
2022 has shown the most downside volatility in the markets since 20091— this bear market is the longest since 20072, and the 4th worst start for the S&P 500 in its history3. This has created panic among retail participants who are starting to throw in the towel— last week being the second largest amount of selling in the last five years.
Closing at the lows—
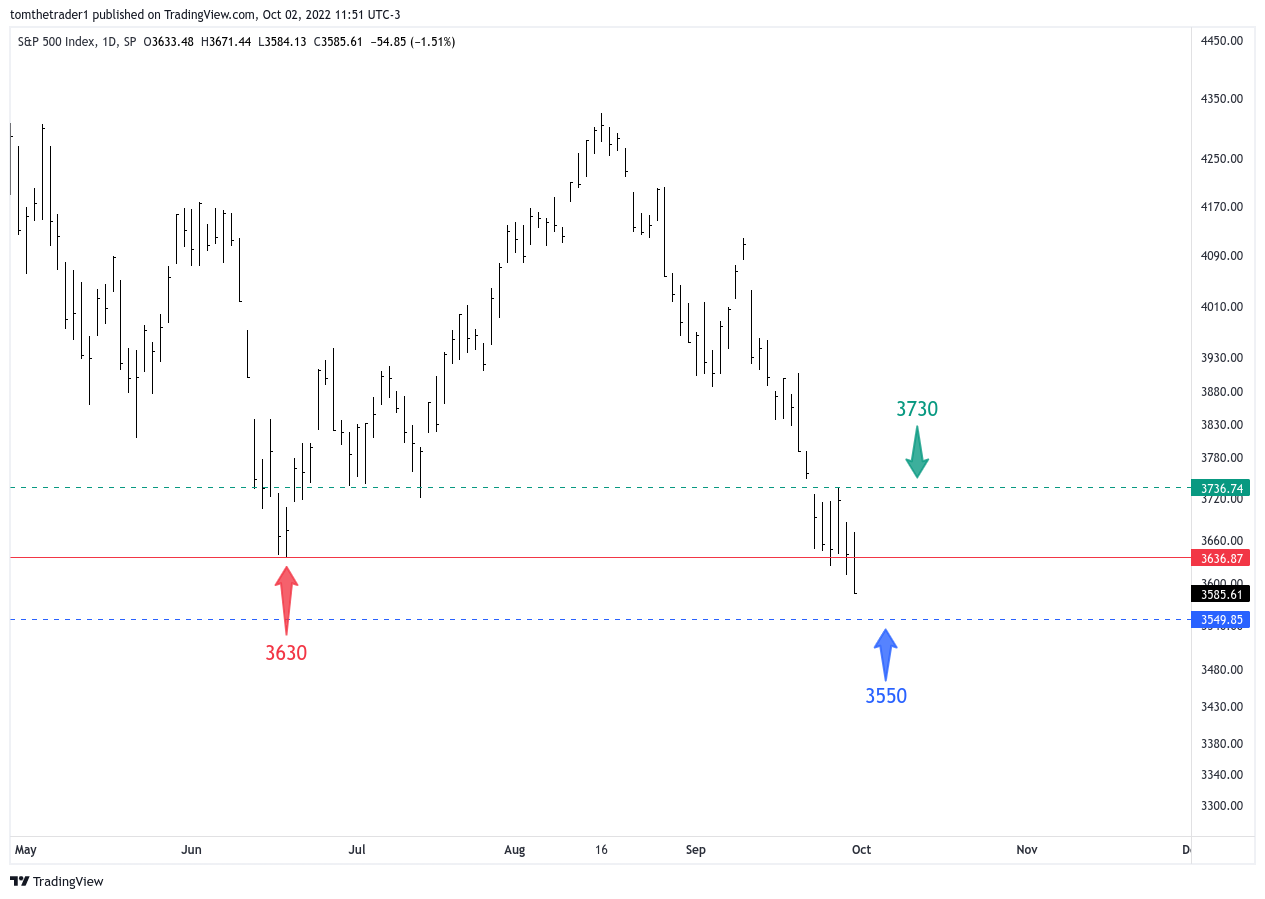
The chart of the S&P 500 highlights the poor health of the market— prices have traded below the June lows, and closed at the low of the month, quarter and year.
A relief rally has yet to materialize— for now, I am keeping open to the idea on a short leash.

The chart of the S&P 500 shows minimal support below the 3630 June low (red arrow)— however, there is one area of interest around 3550 (blue arrows) that brings the market back to prices last traded during the summer of 2020 and leading into the US federal election.
My current thoughts are:
Inflation, interest rates and a declining stock market— the environment still reads like 1969— keeping the analog as an acceptable comparison. (If you are a new subscriber— I encourage five minutes to catch up on this observation. Link here)
For a sustained decline like the -37% 1969 analog— the market needs to cycle in bear market rallies to trap bullish participants. Participant memory is often short and a rally towards 3900 would be cause for celebration— ‘The Bull Trap’
The 3550 support area is approximately 1% away from Friday’s closing price— with such close proximity the validity of the area is likely to be checked soon
Net New Highs

Net new highs— the number of stocks making new highs subtract the number of stocks making new lows. Last week I shared the observation that large negative readings in this metric have preceded all of the relief rallies in 2022— the net new highs closed above the peak low on September 23. If this correlation is to continue— a relief rally needs to occur promptly.
Relief Rally Conditions
The idea of a relief rally towards 3900 is on a short leash following last week's continued market breakdown. The conditions for navigating this brief segment of the cycle
Prices stay above 3550
Price trades above 3630 June lows
Price trades above 3730
The relief rally trade becomes a more probable and better risk managed idea as price trade towards 3730.
The Bigger Picture—
In 1969 the relief rally at this stage occurred over two weeks— it would not be surprise if a relief bounce in today’s market was quicker and sharper. In the bigger picture— I am anticipating this relief rally to be temporary before the downtrend resumes.

Michael Burry shared an interesting market statistic on the weekend— suggesting more downside before the bear market concludes.
“13.48% of stocks closed above their 200 day moving average yesterday. Bottom i 2009 was 1.2%. Bottom in 2020 was 2.8%”
Thanks for reading— I appreciate you making Lines On A Chart a piece of your weekend market prep. If you enjoyed this piece— please consider sharing & subscribing.
How Timely Are The Insights?
Aug 31— it was shared that the market looked like 1969— the environment matched and so did the chart. The article warned of a bearish crossover— that happened the following week
Sept 18— the article reviewed the technical deterioration in the S&P 500 writing of a high probability that the June lows are visited— which occurred the following week
Sept 25— continued the 1969 analog comparison highlighting the double bottom as an area to initiate a relief rally— accuracy to be determined, so far incorrect.
Disclaimer: I am not a financial advisor— this article is not financial advice or a recommendation for any investment— The content is for informational purposes only and to ignite the brain neurons.