


The stock market looks like 1969
Inflation, Rising Interest Rates and the Stock Market meet again— is it different this time?

In early August I traversed down the “what did other market corrections look like?” rabbit hole— particularly what common traits they shared on the reversal that concluded significant market declines.
I have found some common characteristics on successful reversals— and following a moderate study it stands out that the market decline of 1969 shares similarities in shape, magnitude, and environment when compared against the current day market decline. In the upcoming series of newsletters I will discuss key notes from my study.
Straight to the point—
Starting with 1969—

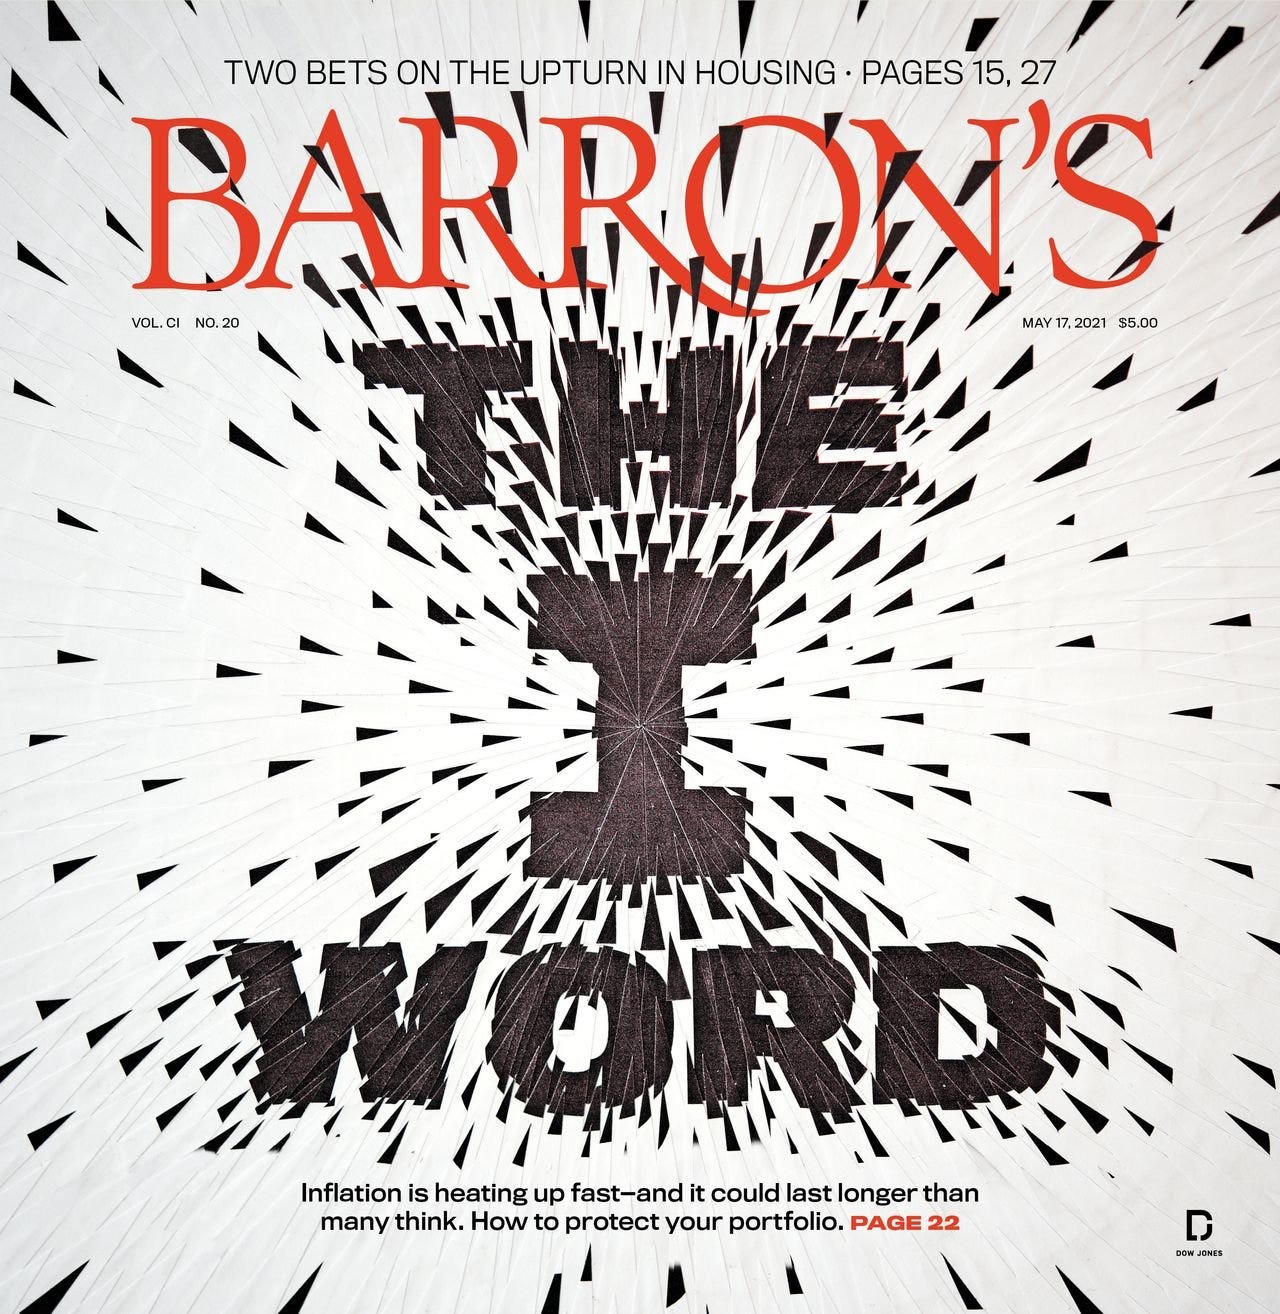
Leading into the stock market decline, inflation was rising from 3.1% in 1968 to 5.3% by 1970. During that very same period the Federal Reserve doubled the federal funds rate from 5% to 10.5%. At the surface— this reads similar to todays environment and headlines of persistent inflation and central banks raising interest rates in an attempt to contain the inflation beast. Barron’s cover for May 2022 as a reference.
The Charts—
The charts that follow use the S&P 500, SPY 0.00%↑ to showcase the bear market decline shaped by a series of breakdowns, and rejection at the long duration moving average (200d). The magnitude, or % decline is relatable to the current market— this is an important observation because then with some degree of confidence it can be assumed that the emotions of the market participant across both time periods is alike.
The 1969 market decline marks two breakdowns— defined by a crossover in moving averages (20 cross below 50, red below black), and later rejection at the long duration (200, blue) moving average before *finally* marking a bottom 11 months later. In the image below these are marked initial breakdown, secondary breakdown, and final rejection.

The initial declines moved the index -11% and -19% from the high, and subsequent to each decline was an advance just as powerful— it makes for a difficult market to navigate (kind of like now). A pivotal moment in the decline occurs when the long duration moving average becomes resistance (instead of support)— it is at this point that the final segment of the decline begins taking the market to its final low, -37%.
Fast forward to today—
8.5% inflation, and central banks raising interest rates at a record clip. Again— at the surface this reads similar to 1969 and so does the chart.

The current market decline shares a similar shape with two declines, magnitude, and is now approaching the next inflection point where the long duration moving average becomes resistance. A notable difference between the two periods is the speed of the decline— it is sharper in 2022 vs 1969. I think this difference can be attributed to the internet, social media, and the market accessibility.
If the rest of the story reads *similar* to 1969 then trading should continue to take place under the 200 day moving average for the foreseeable future, and in the immediate term a bearish technical crossover between the short (20, red) and medium (50, black) duration moving averages. For fun— if this is like 1969 then the current day market decline will carry into September 2023 with the S&P 500 trading around 3033. For the record— I think that sounds miserable.
I’m going to continue covering this thought as the market trades over the coming weeks and months. My next newsletter will continue from this same period of study, highlighting the common traits observed on the real reversals that put an end to the bear markets.
Let me know what you think?
I’m interested in your thoughts— what do you think? Tell me in the comments
“History doesn’t repeat itself, but it often rhymes” — Mark Twain
Disclaimer: I am not a financial advisor— this article is not financial advice or a recommendation for any investment— The content is for informational purposes only and to ignite the brain neurons.
This article provides an insightful look into the stock. The author's ability to break down complex concepts into easily digestible information is commendable. I particularly appreciated the in-depth analysis on providing tips, which offered a fresh perspective I hadn't considered before. Much research went into this piece, making it both informative and engaging.
I look forward to reading more articles like this one. Great job!
<a href="https://abbonews.com/us-markets/future-prospects-metas-stock-price-projection-for-2030/">Meta Stock Price Prediction 2030</a>
Was the job market strong in ‘69 as well? Once unemployment starts to rise we would naturally see less demand and then maybe a fed pivot? -noob