


S&P 500: The Most Important Level
The threshold that ends bear markets


Last week, Wall Street professionals and market participants braced themselves for a heavy earnings reporting period, but the S&P 500 advanced by another 0.8%, extending its impressive seven-week rally. However, this week the focus is shifting back to the Federal Reserve and its interest rate decision on Wednesday.
Despite the recent index performance, my outlook towards the market remains bearish. In my opinion, the current rally is propped up by a select few names, creating a misleading picture of the overall market. This is evident in the poor state of market breadth, which persisted last week and is a key reason why I cannot subscribe to the new bull market narrative. In this week's newsletter, we will revisit the weak breadth data and showcase why I believe that 4220 is likely the most crucial level on the S&P 500 in the near term.
Market Breadth Remains Weak
In the chart below, you can see the S&P 500 in the top panel and a measure of market breadth in the lower panel. Specifically, the lower panel displays the Net New Highs across the Nasdaq and NYSE markets, where negative values (red) indicate more stocks making new lows than new highs, and positive values (blue) indicate the opposite. This is the fourth consecutive week in which the weekly market breadth has been negative. To me, this pattern reflects an unhealthy market behavior and underscores that the recent rally is being fueled by a handful of select names rather than a broad range.

Apple, Google, Microsoft, Amazon, Nvidia, and Tesla, are currently facing critical resistance levels. As I noted in last week's newsletter, the charts I shared then continue to be relevant this week as well. If you missed them, I encourage you to refer to last week's note for more insights. (Apr 23 Letter: Sell In May & Go Away)
The Critical Threshold for Ending a Bear Market
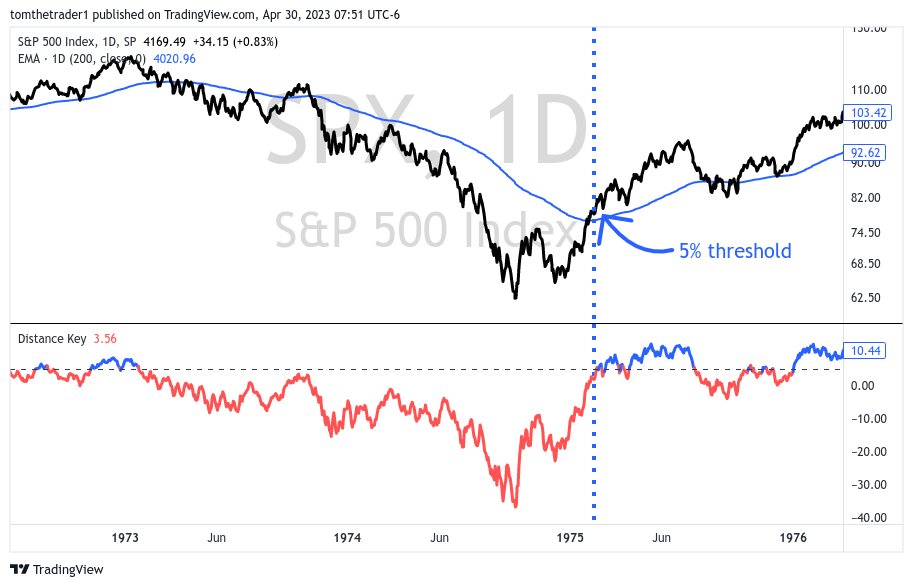
In each of my weekly letters, I emphasize a crucial threshold for the S&P 500 that, in my analysis, signals the end of a bear market and instills confidence in the prospect of a continued market advance. This threshold is not a bottom, per se, but rather a critical marker that can confirm the end of a bear market. Based on my examination of prior bear markets, I have observed that when the index can consistently remain 5% above the long-term moving average (200-day exponential), it is likely that the preceding bear market has ended. However, it's important to note that the S&P 500 has not yet met this threshold, and until it does, I maintain a bearish outlook. The segment below will share that threshold across six historic bear markets, closing with a look at the current day market. In all of the charts below the lower panel shows the distance from the key 5% threshold.
The Oil Crisis from 1973 to 1975 saw the S&P 500 experience a peak-to-trough decline of 49% over a two-year period. Once prices exceeded the 5% threshold, it became clear that the bear market had ended.
During the Volcker Recession from 1980 - 1982, which was characterized by a fight against inflation through rising interest rates, the S&P 500 experienced a 29% decline. Once the market consistently remained above the key threshold the market advance accelerated to the upside.

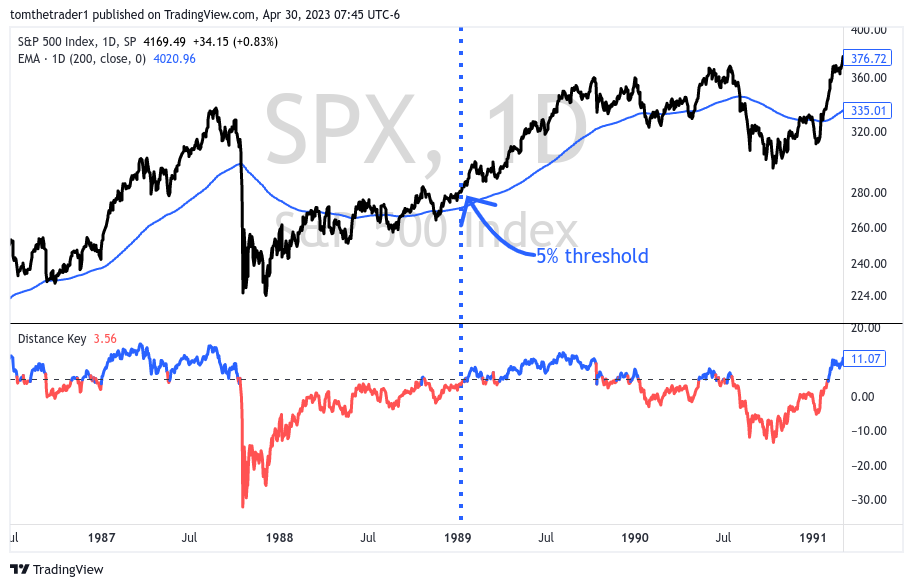
Following the infamous Black Monday market crash of 1987, the market slowly ground upwards for over a year until the 5% threshold was finally triggered
The dot-com crash from 2000 to 2003 resulted in a 50% decline in the S&P 500. While the index experienced several rallies during this time, none were able to successfully end the bear market until the market consistently remained 5% above the long-term moving average (200-day exponential).

The 2008 financial crisis resulted in a significant decline in the S&P 500, with a drop of 57% from its peak. Once prices exceeded a 5% threshold, it was evident that the bear market had ended

The pandemic-fueled market decline of 2020 was sharp, but the subsequent recovery was equally swift. Although much of the losses were recovered before the 5% threshold was cleared, once the market consistently remained 5% above the long-term moving average (200-day exponential), it became clear that the market's upward trajectory was set to continue

Market Outlook: Still Bearish
As for the current market, the S&P 500 has yet to meet the key 5% threshold necessary to signal the end of the bear market under this analysis.

The threshold for the S&P 500 is currently 4222, 5% above the 200-day exponential moving average. A key level for both bulls and bears to keep in mind.
In closing out this week’s note, the key threshold to watch for the S&P 500 is currently 4222, which represents 5% above the 200-day exponential moving average. As history has shown us, a sustained move above this threshold can signal a successful end to a bear market and the start of a new bull market. This threshold has yet to trigger, market breadth is weak, and the market leaders as shared last week are at meaningful resistance levels— for now and until the index consistently trades above the threshold, I remain comfortably bearish and anticipate lower prices ahead.
Timely Newsletter Insights
This newsletter has contained timely insights about the stock market.
From August through September 2022 the articles discussed the technical deterioration in the S&P 500 and projected that the June lows would be revisited, this projection proved accurate as the S&P 500 declined 12%
On September 25, the article identified a potential double bottom with a historic analog as an area to initiate a relief rally. This rally started on October 13 and reached its target area on October 28.
From October 30, 2022 through April 2023, the articles discussed the end of the relief rally. *At the peak of the rally the S&P 500 had extended moderately above the target of 3900-4000. The market has remained in this area through February/March/April 2023. Accuracy of this call remains to be determined.
Disclaimer: The information in this article is for informational purposes only and should not be considered financial advice or a recommendation for any investment. I am not a financial advisor, and the content is not intended to serve as financial advice. It is solely intended to ignite thought and discussion.
Tickers mentioned in this newsletter: SPY 0.00%↑