


S&P 500: Sell in May and Go Away
Market leaders position for a correction


The phrase "sell in May and go away" is a well-known adage in the stock market that suggests investors should sell their stocks in May and hold off on reinvesting until the fall. This strategy is based on historical trends that show the stock market typically experiences lower returns during the summer months, with September being the worst month for stocks on average. However, as with most adages, it is not a one-size-fits-all approach. Monthly seasonality analysis in the stock market often fails to address the bigger picture of market conditions, such as whether it's a bull or bear market. To truly understand the effects of seasonality, it's essential to consider the environment.
Sell In May & Go Away
The S&P 500 remains in a bear market, and to gain a more comprehensive understanding of how seasonality affects the stock market in these conditions, we turn to an insightful chart from Topdown Charts. This chart provides an analysis of the seasonality of the S&P 500 during bear markets, taking into account two key criteria: when the price is below the 200-day moving average and when the market finished the year down.
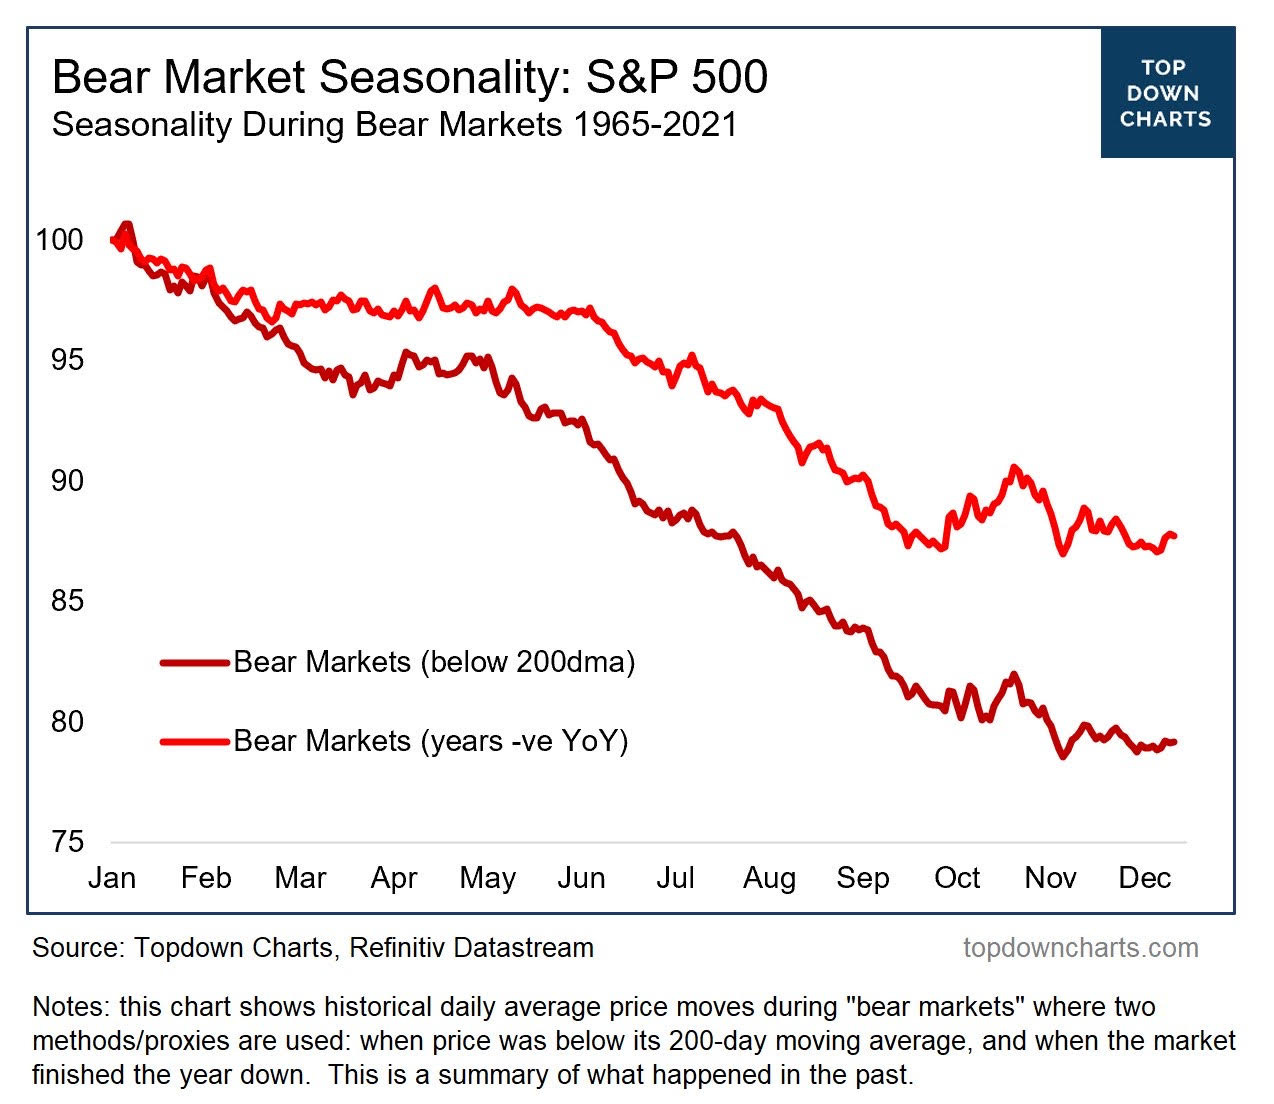
Currently, the S&P 500 is trading above the 200-day moving average, so the brighter red line on the chart is most relevant. It's noteworthy that this analysis shows a virtually flat performance from March through May, which aligns with the current sideways performance in the market and could suggest that we may experience another month of choppy market conditions before a clear direction emerges— thereafter “sell in May and go away” is a preferred strategy as the seasonal decline carries throughout the remainder of the year. I am of the opinion that this will be a profitable theme for 2023.
Market Breadth Remains Weak
A measure of market breadth as calculated by Net New Highs across the Nasdaq and NYSE markets is displayed in the lower panel of the chart below. More stocks are making new lows than new highs, which, based on my analysis, does not suggest a new bull market. Rather, I believe that the market has witnessed a convincing rally driven by a select group of companies, namely Apple, Microsoft, Google, Amazon, Tesla, and Nvidia.

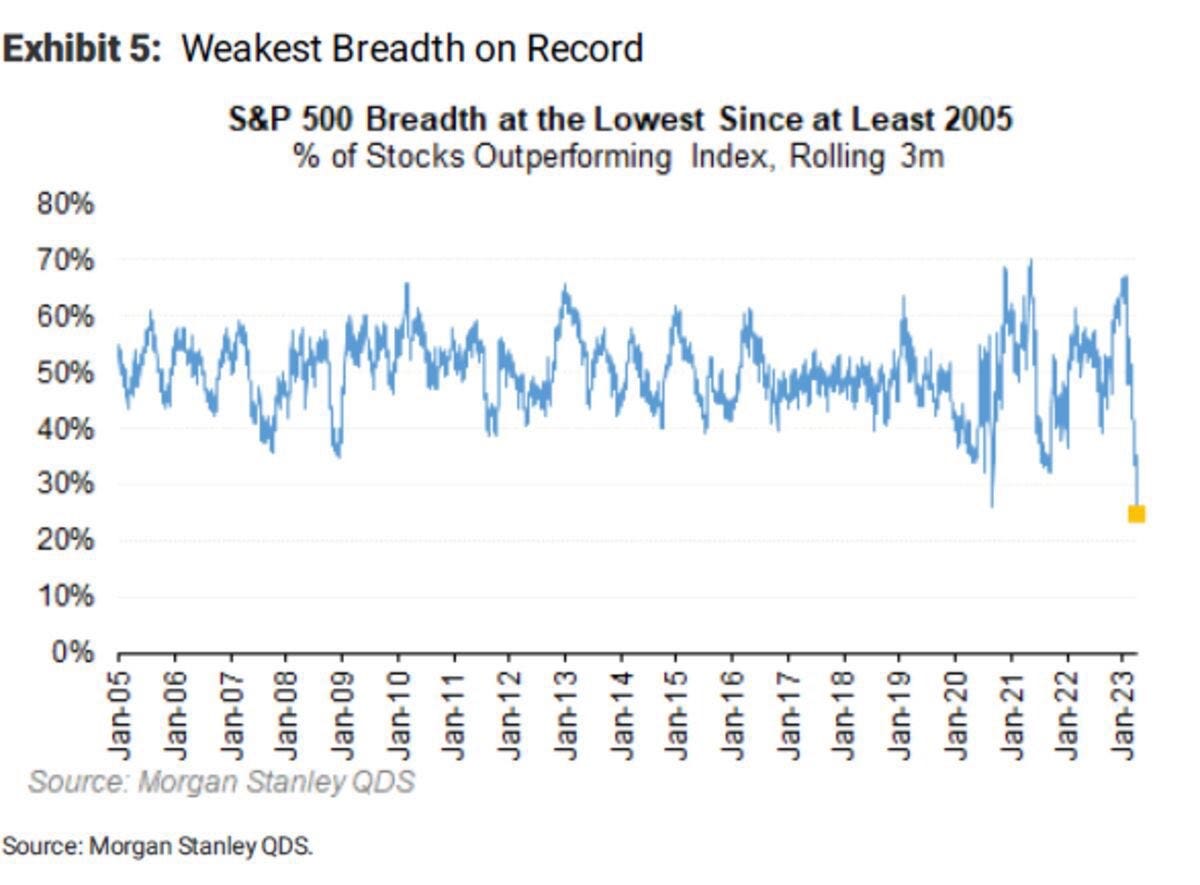
Consistently, this newsletter has been highlighting the poor breadth observed throughout the current market advance. Over the weekend, I came across a chart from Morgan Stanley, which indicated that the S&P 500 has the weakest market breadth on record since at least 2005.
Clear Resistance For Rally Contributors
The now 6-week advance in the market can largely be attributed to six major players, namely Apple, Amazon, Microsoft, Google, Nvidia, and Tesla. However, each of these market leaders is trading at clear levels of resistance, with some already showing signs of rejection. I anticipate that as these six contributors in the S&P 500 begin to roll over, the next decline segment in this bear market will be underway.
Apple stock is currently trading near the upper end of a well-defined channel.

Microsoft is trading at the upper range of resistance.

Amazon share price in the bigger picture continues to make lower highs and lower lows finding rejection at well defined levels of resistance.

Google defined choppy support between 105-110 in 2022, and this year the same area is delivering choppy resistance.

Semiconductor chip maker Nvidia has enjoyed the speculative “AI” euphoria creating a remarkable advance in the stock. I anticipate the unwind to be equally exciting. Nvidia is trading at the upper range of a visible pivot.

After doubling from its 2023 low, Tesla met resistance at a visible 210 level. Currently, Tesla appears to be continuing its correction and closed below 175 at the end of last week.

Market Outlook: Still Bearish
My portfolio and outlook continue to reflect a bearish stance on the market. As active readers are aware, my study of previous bear market rallies has identified a key criteria that defines the rallies that end bear markets: a sustained 5% advance above the long-duration moving average (represented by the blue line in the chart below, which is the 200-day exponential moving average).

The S&P 500 closed last week 2.84% above the long duration moving average. Currently 4216 markets the 5% threshold. In my view, this suggests that the bear market is not yet over and lower prices remain ahead.
Timely Newsletter Insights
This newsletter has contained timely insights about the stock market.
From August through September 2022 the articles discussed the technical deterioration in the S&P 500 and projected that the June lows would be revisited, this projection proved accurate as the S&P 500 declined 12%
On September 25, the article identified a potential double bottom with a historic analog as an area to initiate a relief rally. This rally started on October 13 and reached its target area on October 28.
From October 30, 2022 through April 2023, the articles discussed the end of the relief rally. *At the peak of the rally the S&P 500 had extended moderately above the target of 3900-4000. The market has remained in this area through February/March/April 2023. Accuracy of this call remains to be determined.
Disclaimer: The information in this article is for informational purposes only and should not be considered financial advice or a recommendation for any investment. I am not a financial advisor, and the content is not intended to serve as financial advice. It is solely intended to ignite thought and discussion.
Tickers mentioned in this newsletter: SPY 0.00%↑ AAPL 0.00%↑ AMZN 0.00%↑ GOOG 0.00%↑ MSFT 0.00%↑ TSLA 0.00%↑ NVDA 0.00%↑
Nice bear this week.