S&P 500: Did It Bottom?
Risk Off Criteria Absent


After two months of volatility and caution, the market is finally flashing early signs of a turn. Here's how I'm reading the shift.
Did The Market Bottom?
Last week’s letter continued the analysis of the market's bottoming process, ending with a clear statement:
"This market is starting to look like one worth shopping."
I formally outlined a preferred shopping zone to begin accumulating long exposure, guided by deeply negative sentiment and active fund manager positioning. This week, we can add another major development: the risk-off signals have finally subsided.
As active readers know, risk analysis is the core value proposition behind the work I share.
Since the February 21 risk-off signal, the S&P 500 declined -19.59% over 31 trading days—a deeper and longer decline than most recent corrections.

Naturally, the next question is— Did the market bottom? In this week's letter, I'll walk you through where my analysis currently leans.
End of April Update
As this is the final letter for April, you’ll find updated charts and notes on all active trade ideas (4). There are no new trade ideas this issue; in fact, the two ideas introduced earlier in 2025 are being closed at a loss after breaching their risk levels during April's volatility.
As this newsletter continues to grow, I'm considering adding a brief midweek update—a < 3 minute read providing a risk environment check and updated "Navigating The Short Term" chart between Sunday issues. If this would be valuable to you, I’d love to hear your feedback!
Risk Off Criteria - 0/3
Three risk criteria determine the broader market environment in my analysis. This section is shared and updated weekly. When all three criteria are simultaneously triggered— this sets off the “alarm”
The system defines the market environment as either risk-on or risk-off using three key criteria. These criteria are shown in the upper, middle and lower panel of the chart.
Short-Term Trend — Price relative to the 20-day exponential moving average on the S&P 500.
Breadth — The number of stocks making new highs vs. new lows across the NYSE and Nasdaq.
Momentum — Measured using the Percentage Price Oscillator on the S&P 500.
For the first time in 10 weeks— the S&P 500 ended the week with all three risk criteria absent.
The S&P 500 closed above its 20-day short term trend.
Breadth concluded the week clinging onto a just barely positive value
Momentum is rising from a deeply negative state— “the overstretched elastic band” as described last week
With all three criteria absent— the market enables consideration for a risk-on environment.

Sentiment & Positioning
The sentiment and positioning segment will be included weekly as the market is being actively monitored for characteristics that support a bottoming process.
The two components to monitor for the bottoming process are:
The reversal of the three risk-off criteria
The state of market sentiment and positioning
At the current juncture, all three risk-off criteria are absent and we know from last weeks analysis that the state of market sentiment and positioning started to tip the hand that a bottoming process was underway.
To measure sentiment and positioning I utilize:
CNN Fear & Greed Index to gauge sentiment
NAAIM Exposure Index to evaluate how active fund managers are positioned
Despite a strong rally through last week— active fund managers did not meaningfully buy the dip— the exposure index rose slightly to 40.67… perhaps a live demonstration of how paralyzing fear can be.

The chart below marks the relative lows of the CNN Fear & Greed Index, and the NAAIM Exposure Index. It appears that yet again the confluence of reduced equity exposure amidst a fear environment is a powerful pair to signal the marking of a relative low.

Navigating The Short Term— Key Levels Into Next Sunday
The “Shopping” and “Selling” zones remain unchanged from the prior week note. The strategy remains to accumulate long exposure within the shopping zone— and trim exposure, collect profits and reassess as rallies approach the Sell zone.
Shopping Zone: 4800–5250
5000–5200: Good value
4800–5000: Great value
Sell Zone: 5400–5750
5400–5650: Good profit-taking zone
5650–5750: Great profit-taking zone
The market is moving quickly—last week, the S&P 500 briefly dipped into the “good value” range before rapidly rebounding toward the “good profit-taking” zone. I began accumulating initial long exposure in the S&P 500 during this move.
If the market continues its sharp recovery toward the upper boundary of the Sell Zone, I plan to take profits on the trade. While the original intent was to accumulate exposure gradually over time, a rally into the higher end of the Sell Zone would fall into the "too much, too fast" category in my view—suggesting the move is more a symptom of volatility.

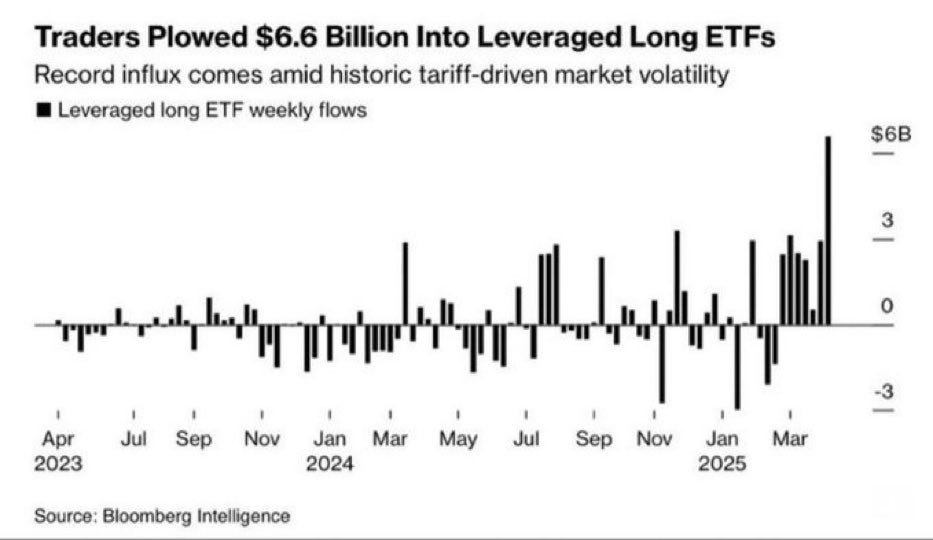
Markets have a way of humbling all participants—and the scenario below would serve that purpose well. Particularly for those who recently set a record in leveraged long ETF buying, a sharp test of conviction would be fitting.

The S&P 500 successfully closed above the short term moving average. While standalone this does not mark a trend change— it is certainly a starting point.
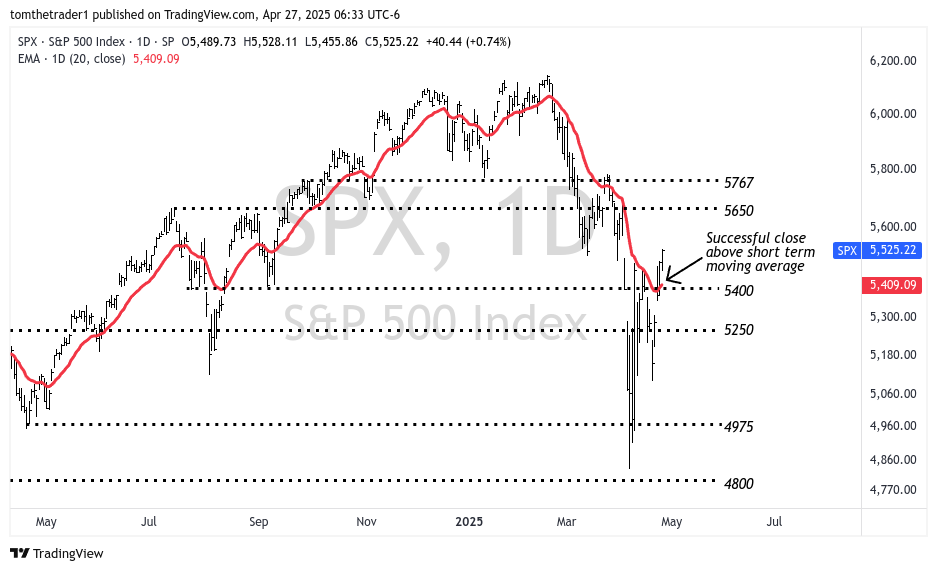
5765 — late September all-time high range + consolidation range prior to next series breakout
5650 — low range of September - October 2024 consolidation + prior all time high range from July & September 2024
5409* — short term moving average
Reclaiming the short term moving average is a step towards verifying a corrective low. When utilized as support on pullbacks this adds a layer of confidence.
5400 — July & September 2024 pivots, this level is nearly aligned with the short term moving average
5250 — April 2024 all time high, May 2024 breakout level— anticipated support if breakdown below 5400
4975 — April 2024 low pivot
4800 — 2022 & 2023 all time high range— breakout level that propelled the 2024 rally
Small Caps
ARK Innovation ETF
ARKK closed above its 50-day moving average. The modern day small cap category is at a level of technical significant with price aligning with the multi year breakout level— currently serving as resistance, and the medium duration average. A break above this level will add a degree of confidence to the general market bottoming throughts.
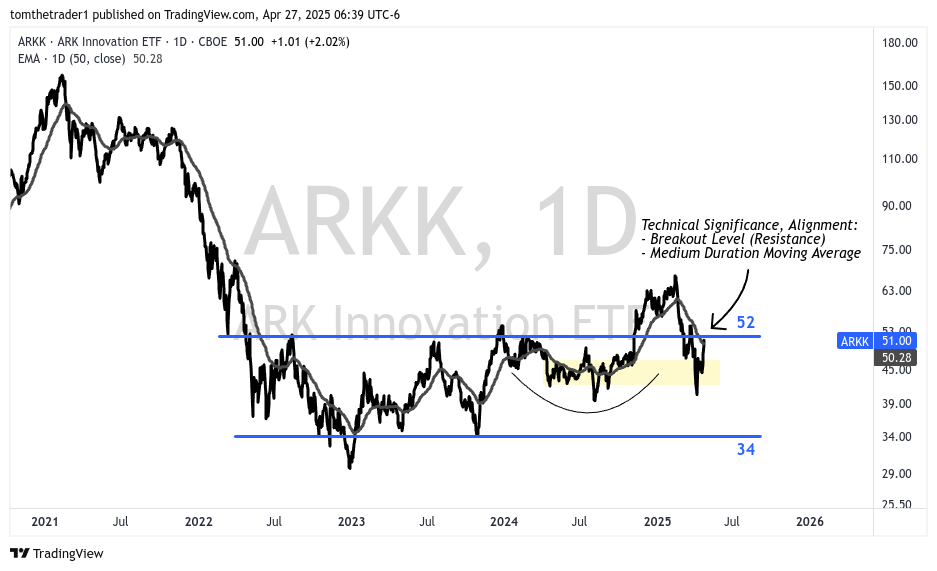
A consistent theme in the outlook I have shared has been that small-cap equities will outperform during any relief rally. Last week shared the trade consideration to long ARKK above the short term moving average as targeting an advance towards the 52 breakout level— this very quickly transpired.

IWM - Russell 2000 ETF
The Russell 2000 (IWM) ETF, the traditional small cap barometer has been slower to rally relative to ARKK. The ETF remains below the 205-212 resistance and the medium duration moving average. The ETF is a laggard of the group to signal the return of a risk-on environment.

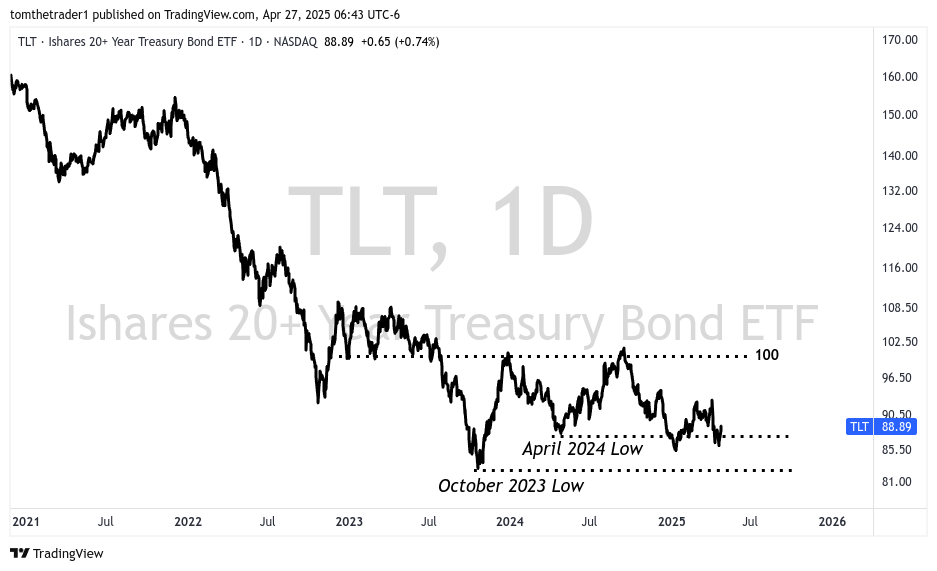
Bonds (20+ Year Treasury Bond)
No major changes in bond positioning this past week.
I have maintained a 20% allocation to long bonds, and my stance remains the same: the bond market continues to offer an attractive opportunity to build a defensive posture.
Earlier this year, I noted that a move above $100 in the 20+ Year Treasury Bond ETF (TLT) would signal risk-off sentiment. That threshold was revised to $90 in January, and TLT continues to trade constructively around that level.