


S&P 500: Melt-Up or Bust
Updated 2024 Outlook


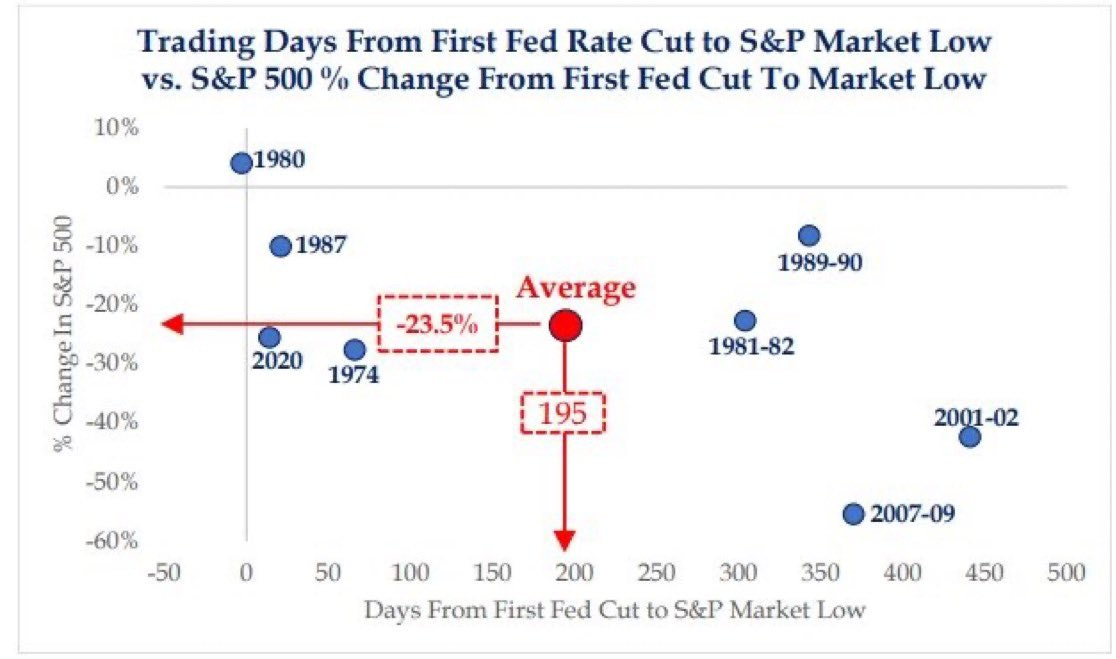
Rate Cuts & Market Bottoms
This past week marked a significant shift for two economies: the Canadian Central Bank and the European Central Bank both cut interest rates. While the US has yet to make a move, economists speculate that the Federal Reserve might announce its first rate cut in September. This development is crucial. The chart below effectively illustrates that markets often bottom out after rates have peaked, with an average decline of 23.5% over 195 days following the first cut.
In the 2024 outlook shared in January, a chart from Bank of America Global Research also highlighted this pattern, showing that markets typically bottom after rates peak.

My own outlook for 2024 (Updated Feb 4) consisted of four components in the order of
A Corrective Move
New All Time Highs well above 5000
Pivot
Next Bear Market
My speculation on the magnitude of the correction was incorrect, a meaningful misstep in this year's analysis. The decline through April turned out to be moderate— with a peak-to-trough decline of 5.9%.
This week's letter will update the three risk-off criteria and conclude with a set of scenarios to consider for the remainder of the year.