


S&P 500: Bull Vision Pro
February Thoughts


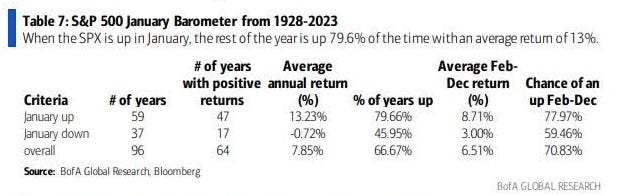
The S&P 500 closed January with a gain of +1.58%, despite a notable single-day decline of 1.6%, the largest since September. According to the January barometer—a historical indicator dating back to 1928—this positive finish bodes well for the year, historically resulting in a positive year-end 80% of the time with an average annual return of 13%. The data leading to that analysis dates back to 1928— with nearly 100 years of market results and an 80% positive result, this is not a data point to ignore.
The wind is at the back of the bull participant— however make no mistake that the high probability for a positive year in the market will not make it easy, nor will it preclude participants from potential healthy corrections that reintroduce fear into today’s greed fueled environment.
Last week brought notable events, including earnings reports from market giants and Federal Reserve Chairman Jerome Powell signaling that a rate cut in March is unlikely. Despite the initial response, marked by a substantial one-day decline on Wednesday, the market swiftly rebounded, recovering the majority of the losses by Thursday. Once again, the major market indices closed at all-time highs.
Newsletter Housekeping
Before progressing into the charts, a quick update on newsletter logistics— we've completed the first month of Lines On A Chart as a reader-supported publication. Throughout January, all subscribers received small previews of each note, a practice that will conclude in February. Going forward, one note per month will remain accessible to all, while the rest will be exclusive to subscribers.
In the upcoming week, subscribers can expect updates on the three trade ideas shared in January, insights into how I manage them in my own portfolio, a detailed look at the next trade I'm positioning for in 2024, and the customary S&P 500 updates that shape my analysis of market health and overall direction.
At A Glance
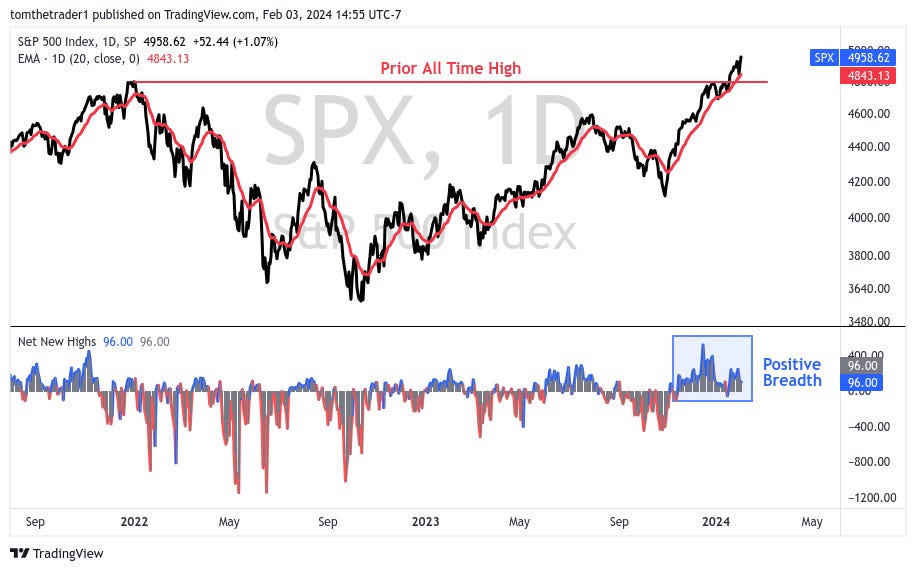
The “at a glance” look of the S&P 500 reveals a breakout above its previous all-time highs, accompanied by a few minor, healthy declines that retraced to the short-duration moving average (20-day exponential). Moreover, positive breadth, measured by Net New Highs, has been a consistent attribute throughout the entire advance that initiated in November. Notably, Goldman Sachs' desk marked the rally of the last three months as ranking in the 99th percentile of market history.
This analysis is interpreted as favorable for sustaining the longer-term trend, with any corrective declines seen as inherently healthy in their initial phases.
(Net New Highs = # of stocks making new highs - # of stocks making new lows, across NYSE and Nasdaq markets)
February Seasonality Thoughts
Two overarching considerations to bear in mind for the month of February:
Historically, over the past 20 years, the S&P 500 tends to returns most of its advances by month-end

Notably, February stands as the second-worst month for the Nasdaq, as per one-month returns dating back to 1985

Correction Conditions— 0 for 3
Three conditions have been detailed in previous notes, closely monitored as potential harbingers of an intermediate high and subsequent correction. However, it's crucial to acknowledge that betting against the market advance remains a risky proposition until these conditions manifest. The three criteria are:
Price trades below the short duration moving average (20 day exponential)— signifying the loss of the short term uptrend
Breadth turns negative— more stocks make new lows versus new highs
A concluding momentum interruption
The chart below of the S&P 500 illustrates the first two criteria. The dotted black vertical lines mark moments when price traded below the short term moving average and breadth turned negative.
As of last week, the short-term moving average sits at 4843. To simplify, price dipping below 4850 would be a preliminary indication of a potential correction. It's noteworthy how the -1.6% decline at the end of January found support precisely at this short-term moving average. Trading below it would mark a discernible shift in character for the index.

The final criteria is a concluding momentum interruption. The Percentage Price Oscillator is used to measure trend momentum and is displayed in the lower panel. In my analysis, a momentum interruption occurs when the initial negative crossover (depicted by the red dot in the lower panel) is not followed by a corrective move. Instead, the price continues to advance with multiple interruptions before a decline materializes.
I speculate that the final interruption in this cycle will follow a trajectory similar to previous cycles. The chart below highlights two past instances of interruption cycles, where the advance made during such periods was ultimately erased by the ensuing correction. A comparable outcome could bring the S&P 500 back to 4550, representing an 8% decline from Friday's closing price. This conjecture aligns with the observed seasonality patterns in the S&P 500.

Once again this week, none of the three correction criteria have been met.
A level that could bring about both a necessary correction to the prevailing market exuberance and, simultaneously, establish a robust structural foundation is a decline in the S&P 500 within the 4500 - 4600 range. This would place the price back at a former resistance pivot and the breakout area that propelled the market to its current all-time highs. An 8-9% correction is likely to evoke sensational narratives across conventional financial media. However, from my analytical standpoint, this corrective move would create a sound structure and should be viewed with a positive bias, positioning the index for another potential upswing.

2024 Outlook: Updated
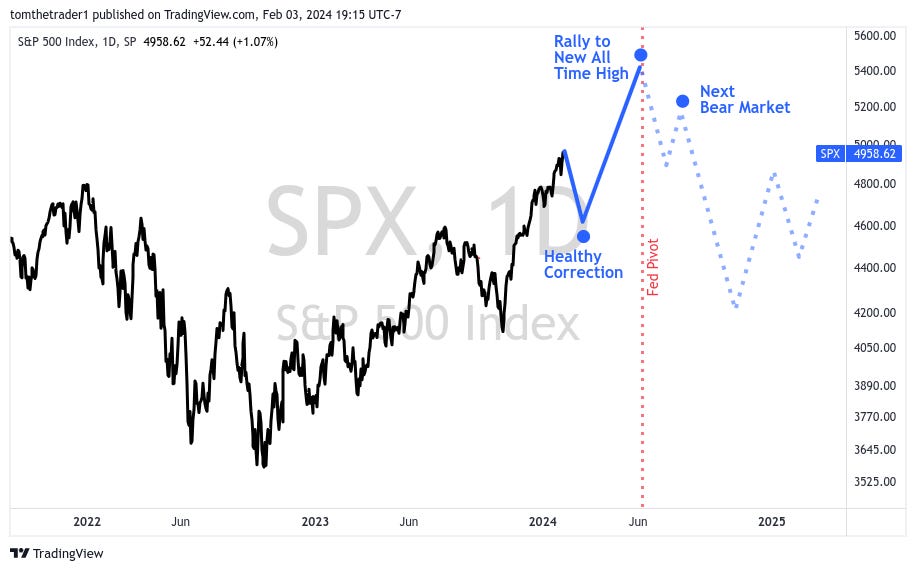
The outlook shared to open the year remains consistent in structure:
Correction to 4500 - 4600: A response to a tempered narrative on early rate cuts, an environment that has operated in greed for nearly 3 months and priced to perfection estimates.
New All-Time Highs well above 5000: My thought is this materializes on the back of renewed speculation for rate cuts and seasonal political factors. Euphoria will be blinding at this stage.
Pivot: My speculation is that the S&P 500 will reach its peak around the time of the first rate cut. With indications from the Federal Reserve last week suggesting March as unlikely, I have adjusted the timeline to June, represented by the shifted red line.
Next Bear Market: Despite the favorable odds for a positive finish in 2024, influenced by the January barometer and election year seasonality, I am currently skeptical that the onset of a bear market will be clearly evident. Instead, a more plausible scenario is the gradual emergence of signs indicating an intermediate high is in development.
While pinpointing the exact peak is inherently speculative, the chart below illustrates a top 5300. If the market follows this speculated path, my core analysis of breadth, momentum, sentiment, and positioning will play a crucial role in gauging the probabilities of a market top—similar to how the current criteria are being monitored for a healthy correction. The dotted segment representing the onset of the next bear market is purely for visualization at this time.
Finding Outperformance
Small Cap Growth
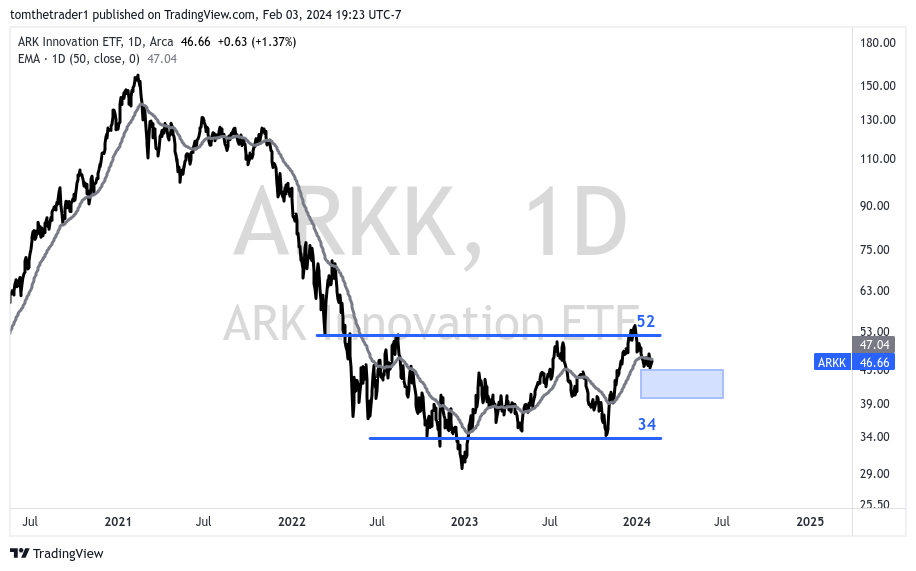
The ARK Innovation ETF (ARKK) is currently situated toward the upper end of my interest range, within the 40-45 bracket. As emphasized in my communications throughout January, I remain skeptical that this category can avoid the impact of a broader market correction. My expectation for February is a potential challenge to the lower boundary at 40. I plan to leverage this scenario as an opportunity to accumulate positions within this market class, augmenting exposure to the three trade ideas introduced in January. Updated charts specific to these ideas will be provided in next weeks February 11th letter.
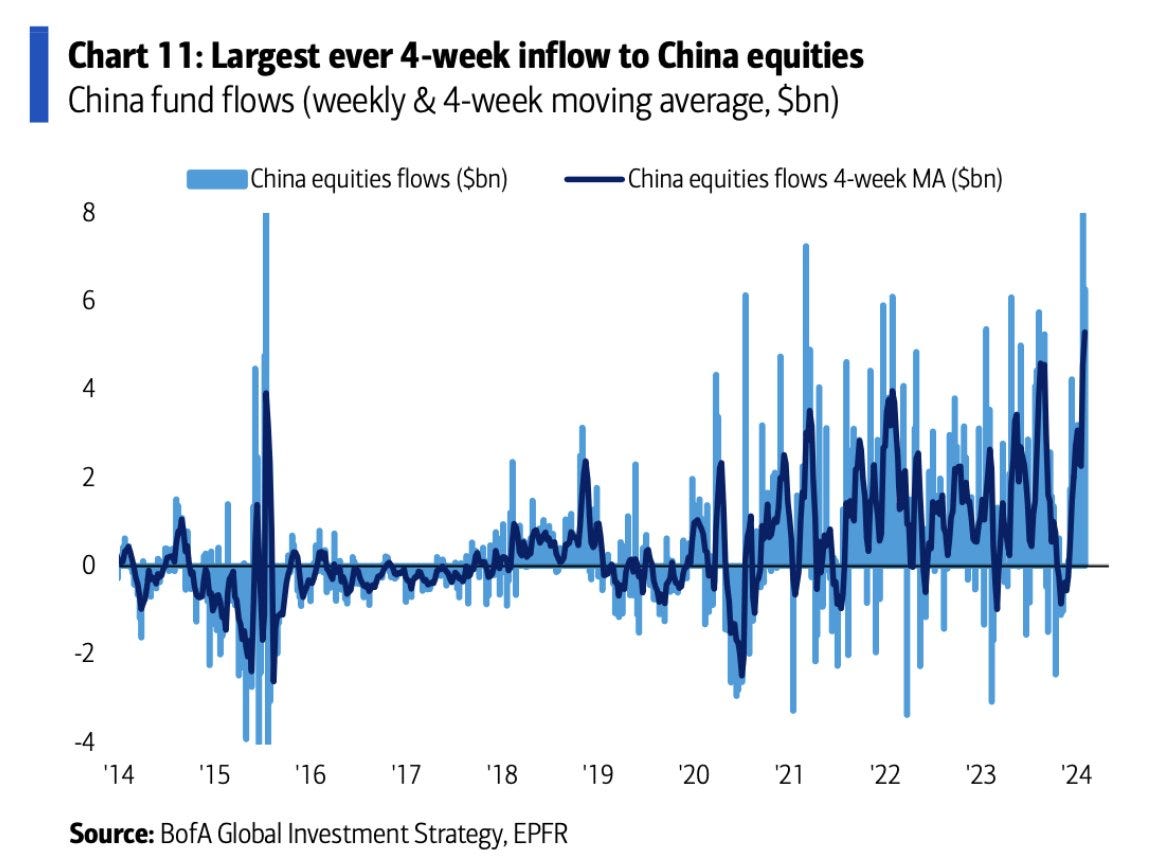
Trading China— Following The Money
In the upcoming week's letter, I will present charts and three ideas reflecting my interest in incorporating exposure to Chinese equities. Notably, the mega caps of the Asian market have witnessed a significant decline of 70-80% from their peaks.
The devastating decline is creating interest among market participants where Chinese equities have recorded the largest 4 week inflow ever.
Disclaimer: The information in this article is for informational purposes only and should not be considered financial advice or a recommendation for any investment. I am not a financial advisor, and the content is not intended to serve as financial advice. It is solely intended to journal thought, ignite more thought and discussion.