When can we be bullish again?
I don’t know— but I think I’ll be know when a rally becomes a reversal.
In August I researched what the charts of the S&P 500 looked like in past bear markets— my goal was to determine if the rallies that concluded bear markets shared a similar technical structure that was simple to monitor. I found what I was looking for and some. It was this period of study where I noted the bear market of December 1968 - May 1970 as a meaningful analog for the current day market. This analog continues to be a primary point of interest in my analysis and this newsletter has covered the subject over the past 10 weeks.
The conversation around the 1968-1970 bear market analog will continue— but this weekend I wanted to talk about the reversals that end bear markets. This is the stage where there is confidence that the bottom is in, and market winds are likely going to be favourable for a sustained period of time.
The technical criteria are simple:
Bullish crossover of the short (20 day) and medium (50 day) duration moving averages— this marks a breakout. This simple crossover happens on all reversals. The strong breakouts carry the rally towards the long duration (200 day) moving average— and the really strong ones extend past
Price advances 5% above the long duration moving average before any constructive pullback — the short duration moving average converges towards the medium
The following grouping of S&P 500 charts will show the bullish crossover, and the point at which the S&P 500 extends 5% above the long duration moving average. At the end is the graph of the current day S&P 500— what it would take to become bullish again.
2008 - 2008
One clean crossover— a short pause at the long duration moving average and the reversal was solidified as price extended above the long duration moving average (blue)
2000 - 2003
Four false bullish crossovers— the final cross bullish crossover (green arrow) propelled price above the long duration moving average. This particular example showcases the value in the second piece of criteria— price must advance a minimum 5% above the long duration moving average.
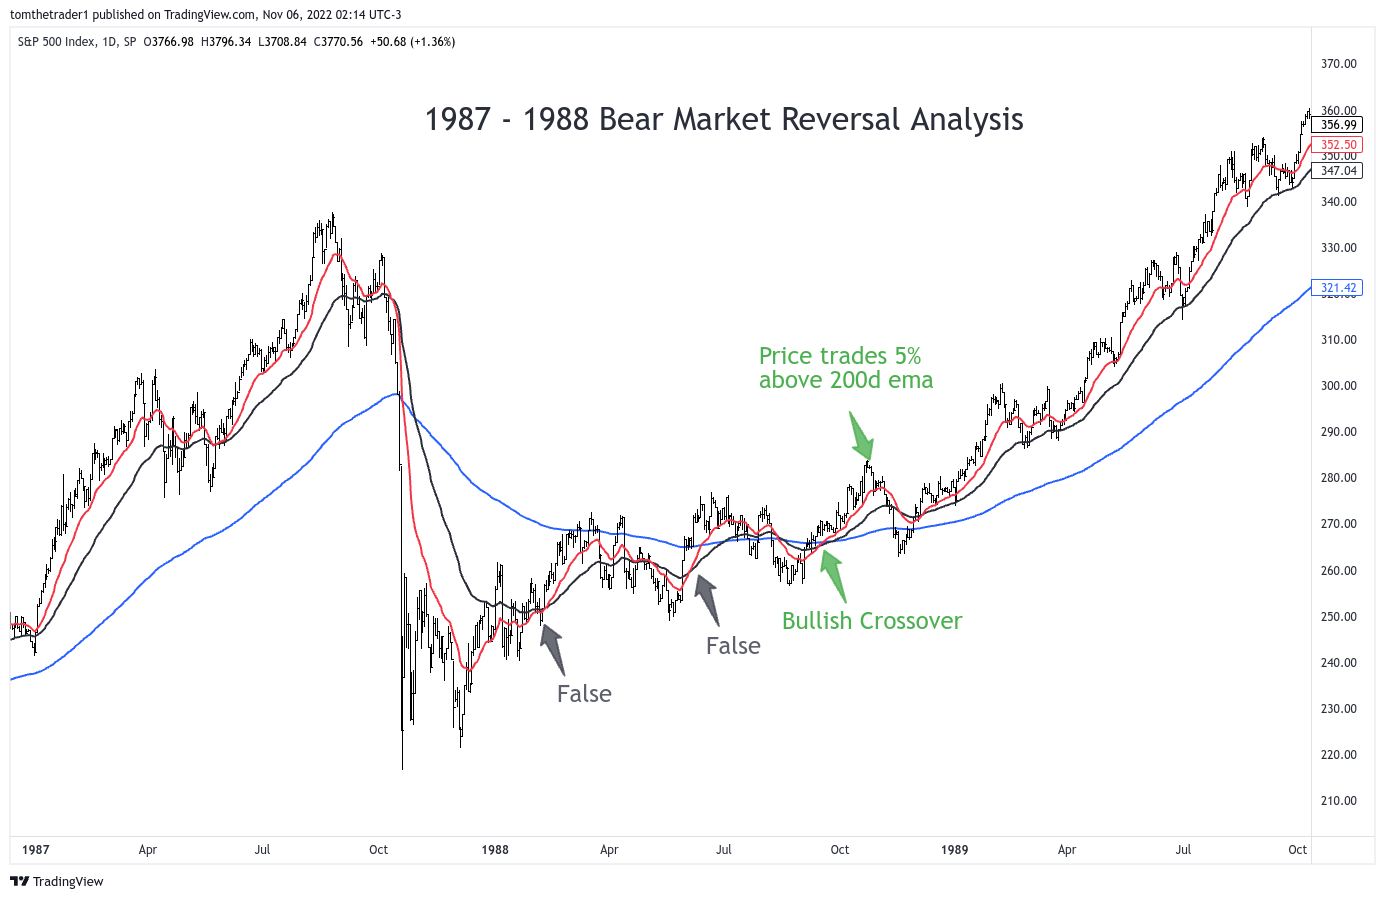
1987 - 1988
Two false bullish crossovers— in both cases price traded above the long duration moving average— but failed to extend above 5%. The final crossover successfully accomplished this.
1981 - 1982
Two false breakouts— both clearly rejected at the long duration moving average. The final cross over was sharp and price never looked back once extending 5% above the long duration moving average.
1973 - 1975
One false cross over near the bottom— the true crossover propelled the above the long duration moving average with conviction.
What will it take to become bullish?
I have shared with readers that my outlook is bearish— however I think it is a good practice to create conditions suggesting it is time to reassess. Those conditions are defined above.
For me to be bullish, four technical events need to occur:
A bullish crossover of the short and medium moving averages
A 5% advance above the 200 day moving average
Confirm support at the 200 day moving average (*this is a bonus, as shown in prior bear market analysis, strong reversals skip this step)
Closing price above 4120
Until these criteria start to trigger— my outlook remains bearish. In a future article I will review bear market bottoms in greater detail. Being able to identify a genuine reversal from one that is false is a good step— but as I am sure you noticed to get to that point is a sizeable rally in itself— I’ll want a piece of that.
Thanks for reading this weekend note— I appreciate you including Lines On A Chart in your market reading. If you enjoyed this piece— please consider sharing & subscribing.
Disclaimer: I am not a financial advisor— this article is not financial advice or a recommendation for any investment— The content is for informational purposes only and to ignite the brain neurons.
Tickers mentioned in this article: SPY 0.00%↑


