
The Bear Reaper
A potential end to a convincing bear market rally

To the American subscribers— I hope you had an enjoyable Thanksgiving and avoided stock talk around the dinner table. The S&P 500 and Nasdaq are down -12% and -26% respectively since last time Thanksgiving dinner was served.

The Same Ballpark—
In the 1980’s inflation was running rampant— as measured by the Consumer Price Index April 1980 recorded a year over year peak of nearly 15%— the index recorded 9% this year in June. By my analysis— we’re in the same ballpark.
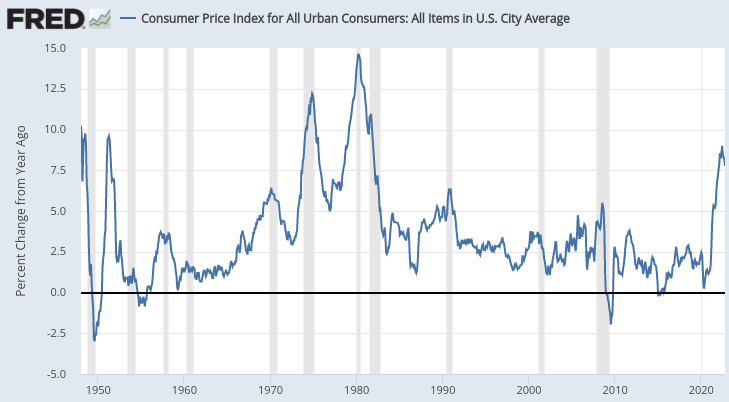
Why does it matter?— I tend to think that humans act mostly the same when faced with similar environments. In the stock market— I extend that thought to the buying and selling behaviors of market participants.
Third Time’s A Charm—
We are creatures of habit— can it really be that simple?
The bear market rallies throughout the 1980-1982 decline share a remarkable similarity when compared against the current day decline. Three clear rejections— all at the golden pocket and the long duration moving average (blue line).
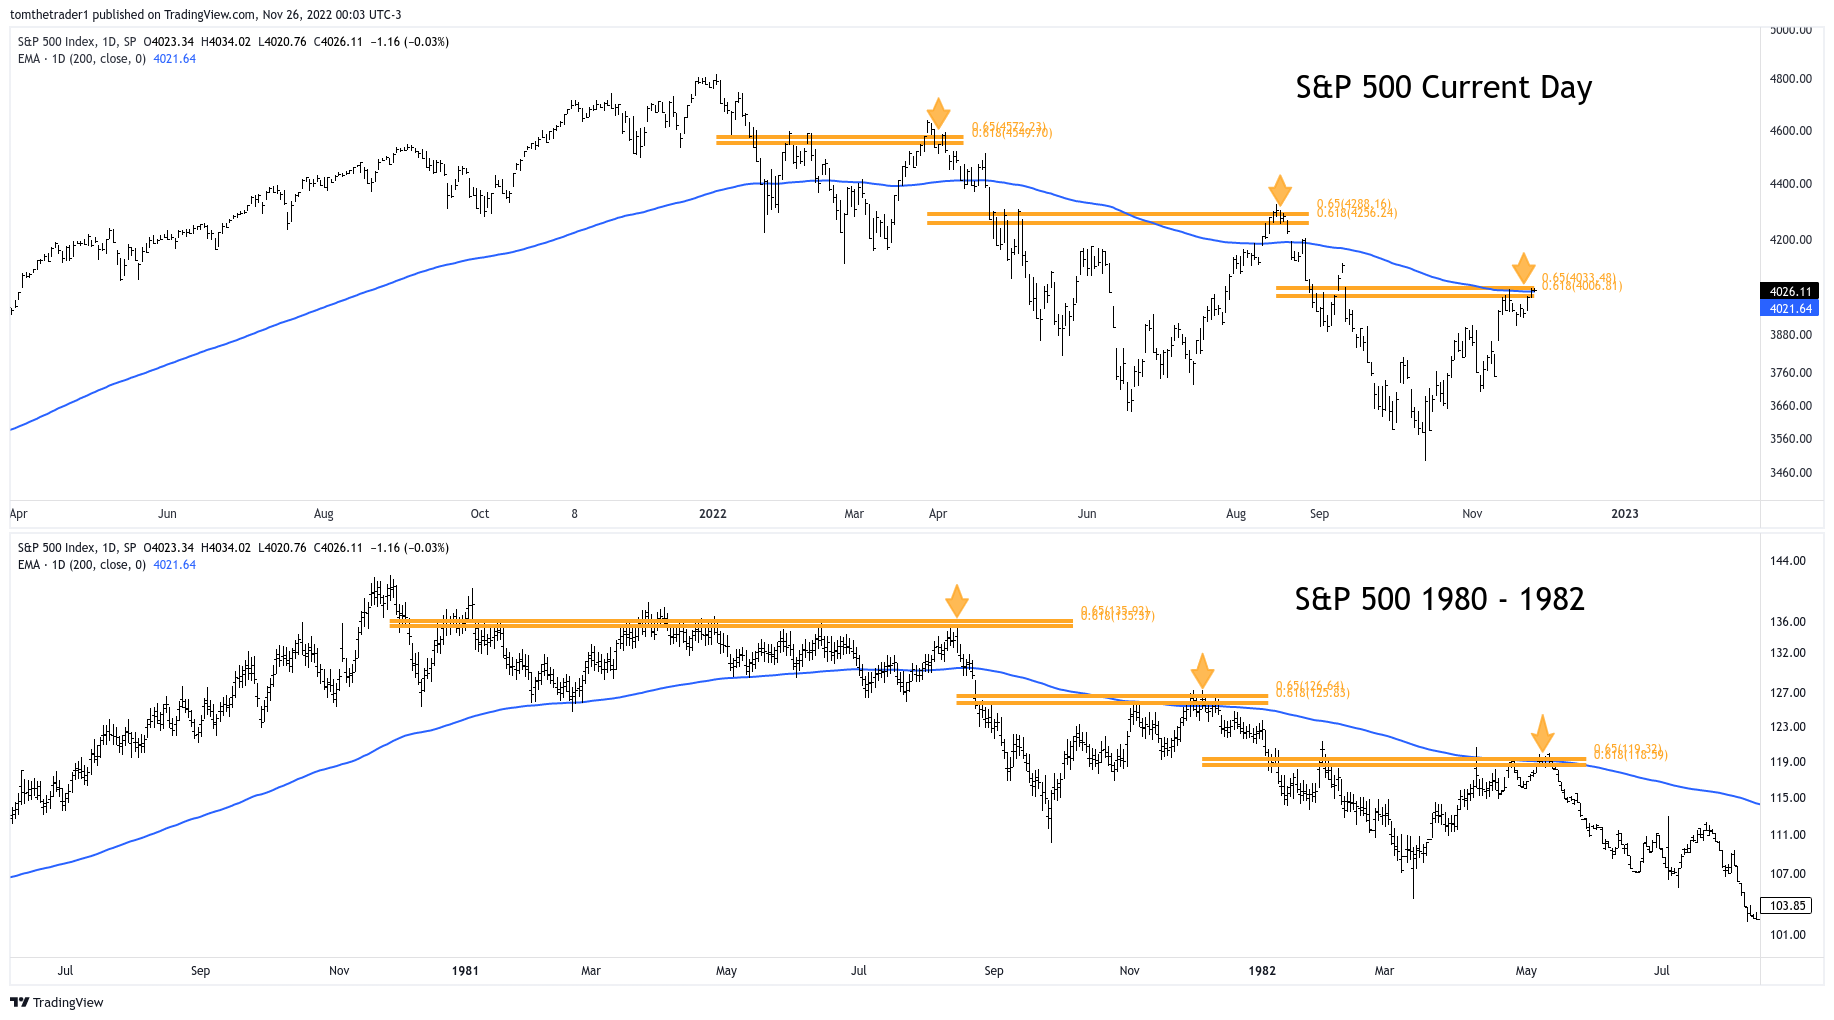
The yellow lines and arrows represent the ‘golden pocket’— a 61.8 - 65% retrace of the prior decline and the blue line is the long duration moving average (200d). The S&P 500 bear market from 1980-1982 contained three significant rallies before the market bottom was in— each terminated after retracing ~62% and the second and third incorporated a visible rejection around the long duration moving average.
The current day market deserves a “hey— that looks the same” type of comment. The first two rallies were rejected at the golden pocket, and the S&P 500 closed last week right at the blue line. Is it different this time?— If the comparison continues to track with accuracy market participants can anticipate the downtrend to promptly resume in the coming weeks.
The Wrong Order—
In analyzing market reversal— the Nasdaq most often leads the reversal out of bear markets. The Nasdaq contains a larger allocation to technology stocks, often viewed as a riskier allocation when compared against the Dow Jones Industrial or the S&P 500. It appears a market participants appetite for risk coincides with new bull markets.
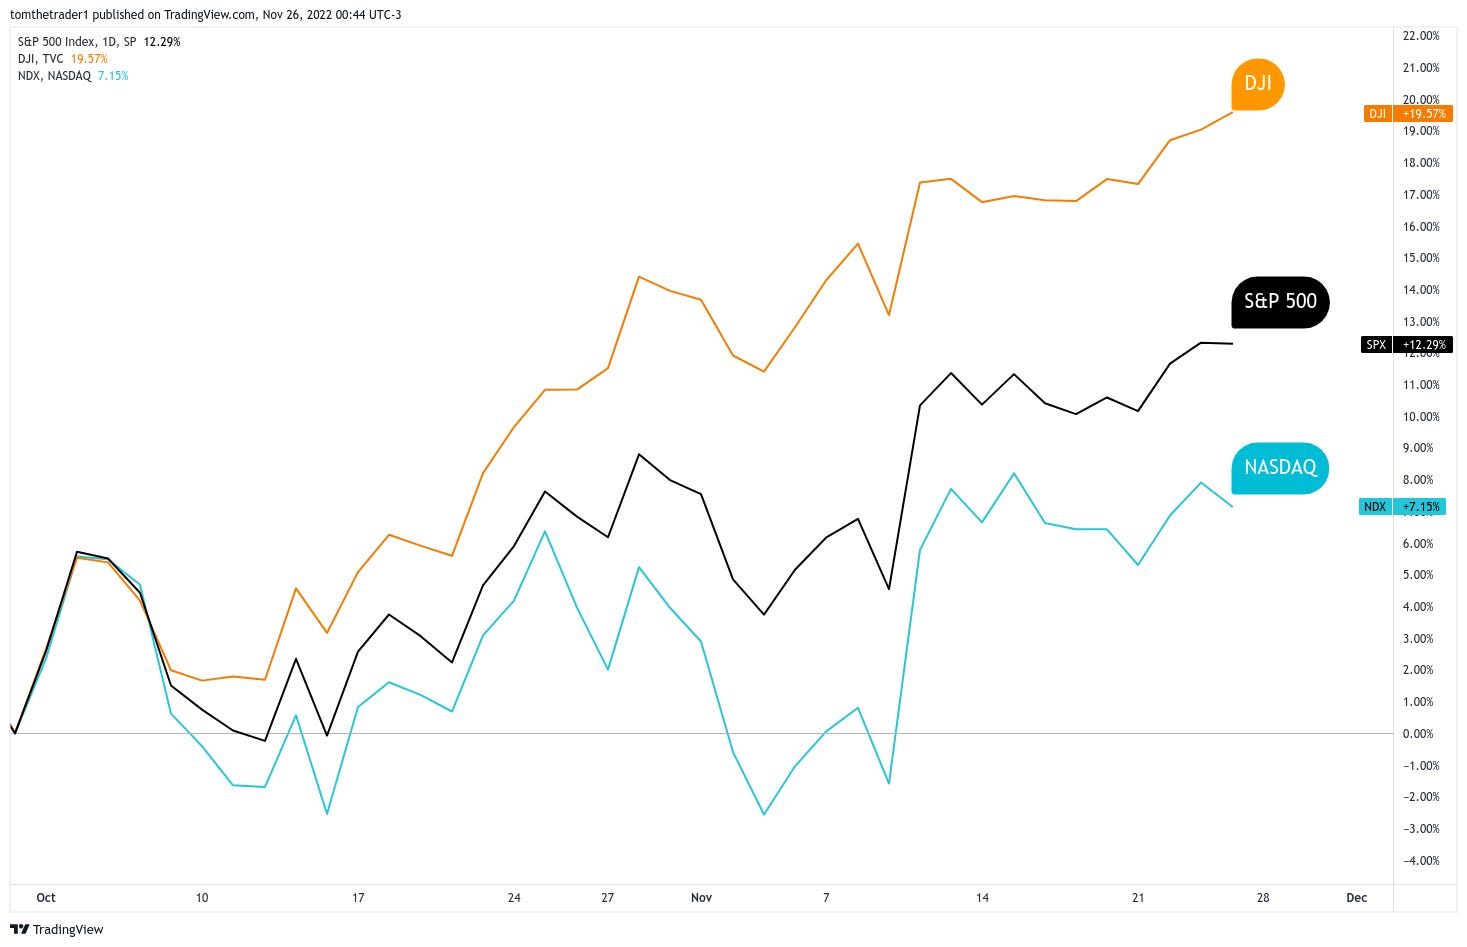
With that— the order of the market rally from the October lows does not align with history. Market participants are favoring the Dow over the S&P 500, and the Nasdaq. This is a defensive risk-off allocation. I do not qualify this as bullish for the aggregate market.
Bearish Thoughts—
From historic analogs (1968-1970, 1980-1982) that share exceptional similarity against the current day market decline to acknowledging that interest rates are likely to continue up and knowing markets bottom more often after rates peak (link here)— it is difficult to qualify this rally as much more than a really convincing bear market rally— plus the order of market leaders in this recent advance is misaligned with the order that successfully concluded bear markets of the past.

Thanks for reading this weekend note— I appreciate you including Lines On A Chart in your market reading. If you enjoyed this piece— please consider sharing & subscribing.
How Timely Are The Insights?
Aug 31— it was shared that the market looked like 1969— the environment matched and so did the chart. The article warned of a bearish crossover— that happened the following week
Sept 18— the article reviewed the technical deterioration in the S&P 500 writing of a high probability that the June lows are visited— which occurred the following week
Sept 25— continued the 1969 analog comparison highlighting the double bottom as an area to initiate a relief rally— rally started October 13 and entered target area October 28
Oct 30— the relief rally is ending— *result to be determined, so far the S&P 500 has paused at the anticipated 3900 - 4000 area.
Tickers mentioned in this article: SPY 0.00%↑ QQQ 0.00%↑ DIA 0.00%↑
Disclaimer: I am not a financial advisor— this article is not financial advice or a recommendation for any investment— The content is for informational purposes only and to ignite the brain neurons.