


S&P 500: Trade War
Creating Uncertainty In The Marketplace


Market Uncertainty: Trade Wars
Welcome to February.
By now, you’ve likely seen the headlines—President Trump has imposed tariffs on both Canada and Mexico, sparking a trade war that has led to retaliatory tariffs from both countries. My key takeaway? Markets dislike uncertainty, and these trade tensions will only add to it. However, as an active market participant, I remain confident in the risk system I’ve developed to signal when a narrative shifts the market into a meaningful risk-off environment.
Markets closed last week with both the S&P 500 and the Nasdaq down -1% and -1.36% respectively. While the DeepSeek narrative from last week created volatility through Monday— the risk criteria never set off the alarm.
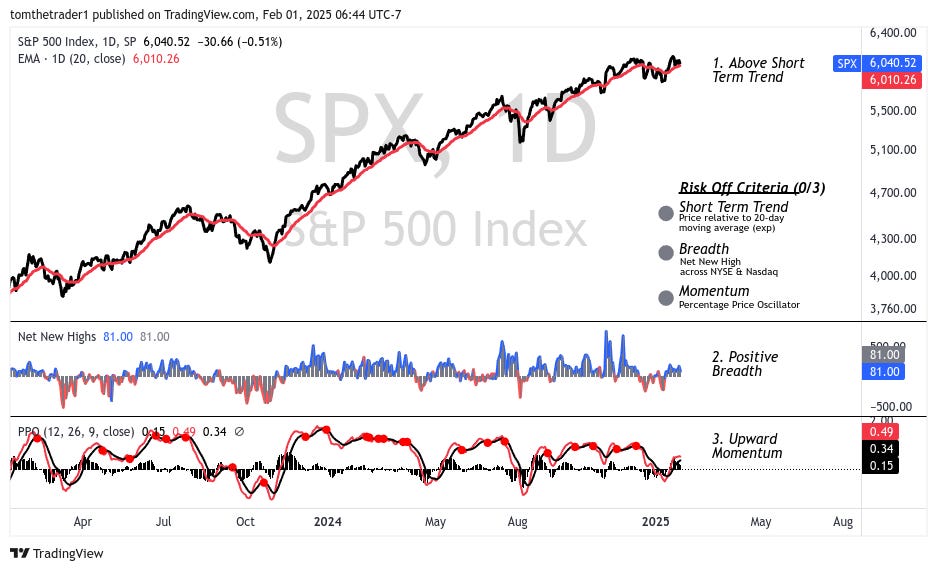
Risk Off Criteria - 0/3
The system I have defined in my market analysis to determine risk-on or risk-off market environments utilizes three components— at the close of January 31, zero of the three criteria were active.
The Short Term Trend— price relative to the 20-day exponential moving average
Breadth— the number of stocks making new highs vs new lows across NYSE & Nasdaq markets, middle panel “Net New Highs”
Momentum— measured using the Percentage Price Oscillator, lower panel
Last week, I noted that the market had resumed its bullish behavior, and based on these indicators, that remained true through the week. However, the weekend’s trade war developments introduce a layer of uncertainty that shouldn’t be ignored.
Currently, the S&P 500 is holding just 0.5% above the short-term trend—leaving little room for error—while breadth remains positive, and momentum has turned upward. If the risk-off criteria trigger an "alarm," an out-of-cycle note will be issued to upgraded subscribers.
Market sentiment as reported by the CNN Fear & Greed index ended last week in a neutral state.

Navigating The Short Term
For the last two months the short term analysis has focused on the 6000 level in the S&P 500— this level was responsible for the breakdown on December 18th, and equally responsible for the rally that pressed the index into fresh all time highs just a few weeks ago. This same level currently coincides with the short term moving average— one of the key components in risk-off criteria.
Despite early fear in the week stemming from the DeepSeek narrative the S&P 500 did not have one single daily close below the short term moving average.
The short term will continue to revolve around the 6000 level— keep above the the bullish melt-up narrative remains alive, break below and one risk-off criteria immediately sets off.
Key levels into next Sunday letter:
6010* — short term moving average, risk becomes elevated if the moving average fails to offer support, failure opens the decline to the next level of support (5875)
6000 — Sustaining above 6000 will erase bearishness regardless of media headlines (ie. DeepSeek, Trade Wars, etc)
5875 — represents a previous all time high range, and now a critical support level. Failure to sustain 5875 opens the index for further decline towards 5767 (and later 5650)
5765 — late September all-time high range + consolidation range prior to next series breakout— the immediate support level if the index closes below 5875
5650 — low range of consolidation (level not included on chart)

Small Caps— Doing Everything Right
ARK Innovation ETF
The ARKK chart through last week maintained excellent chart integrity. The medium duration moving average (50-day exponential), which has historically provided support through longer duration advances continues to support the ETF.
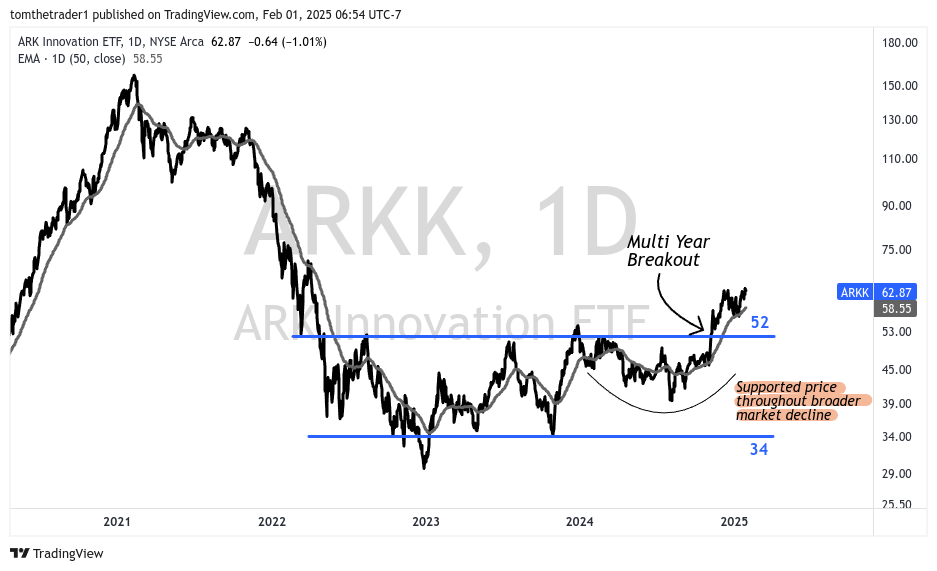
From my perspective, ARKK remains as a risk-on trade until price fail to hold above 58, and more importantly above 52.

I remain positioned long ARKK.
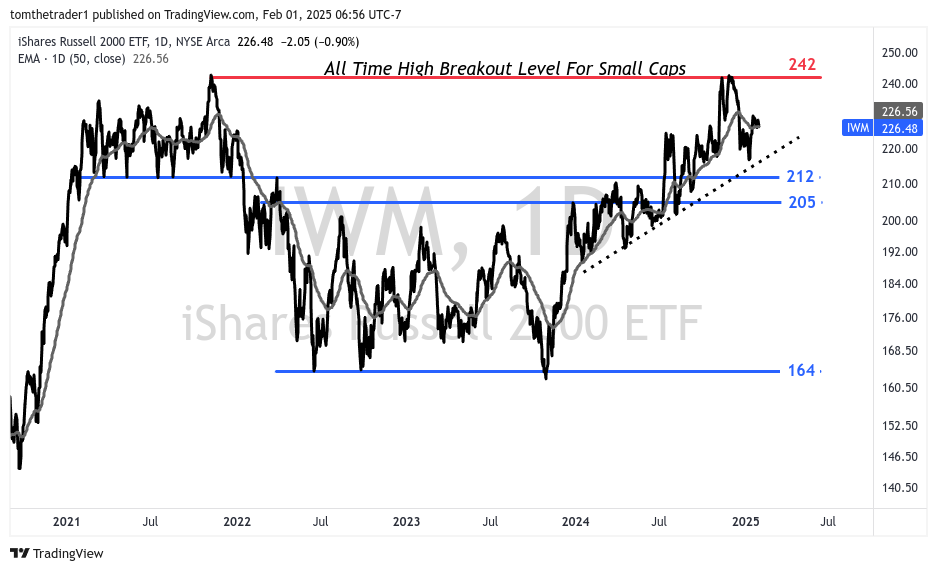
IWM - Russell 2000 ETF
No changes to IWM context from last week
The traditional small cap category, the Russell 2000 remains in a state of wide consolidation just below the all time high breakout level.
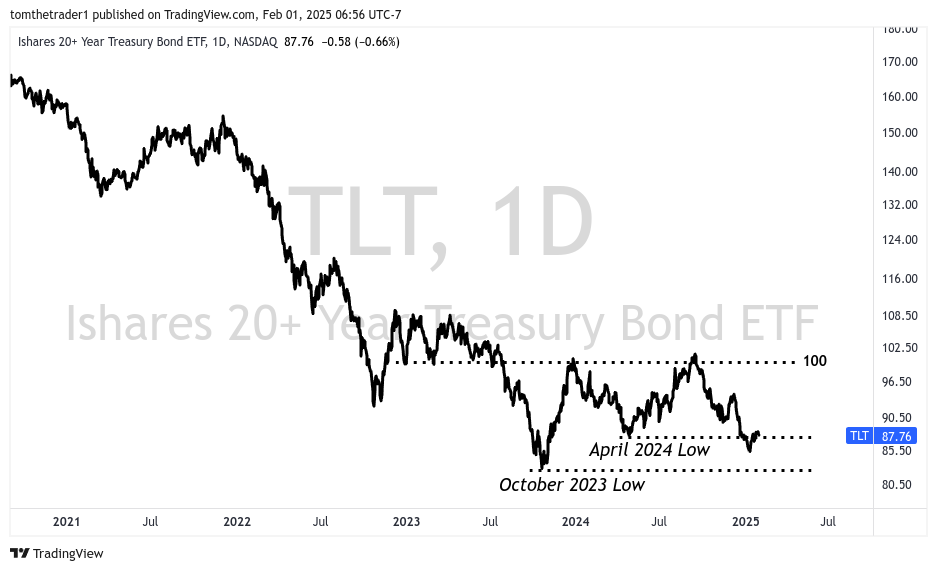
Bonds (20+ Year Treasury Bond)
No changes to bond context from last week
I view an advance above $100 as a potential signal of risk-off sentiment in U.S. equities. However, two letters ago I have revised this outlook and now see $90 as a more realistic threshold and view bond positioning as a prudent defensive posture.
Summary Outlook: Bullish Until Risk-Off Alarm
The bullish scenario last week returned front and center— my outlook is to remain bullish until the risk-off alarm, at which point I will look to hedge my long exposure with a short S&P 500 position.
Melt-Up Speculation and Small Caps
I continue to speculate that small-cap equities—particularly ARKK—will outperform in a melt-up scenario. The critical level for ARKK to maintain is above 58.
Bullish Scenario: Position overweight in small-cap equities, focusing on ARKK. Key signals include the absence of risk-off criteria in the broader market and breakouts in ARKK and IWM above 52 and 212, respectively.
Update: ARKK remains long; the key level to sustain is above 58.
Hedging Update: No active hedges.
Bearish Scenario
In the bearish scenario, the strategy shifts to shorting the S&P 500 and increasing bond exposure. Signals for this scenario include all three risk-off criteria being active, with long bonds becoming favorable if TLT (iShares 20+ Year Treasury Bond ETF) trades above 90.
As we head into the week of February 3, 2025 the outlook remains bullish until the risk-off alarm says otherwise….. (I have a speculation I will be writing sooner than next Sunday)
Trade Ideas
In case you missed it— all active trade ideas were updated in last weeks letter, including the first new trade idea for 2025.
Disclaimer: The information in this article is for informational purposes only and should not be considered financial advice or a recommendation for any investment. I am not a financial advisor, and the content is not intended to serve as financial advice. It is solely intended to journal thought, ignite more thought and discussion.