


S&P 500: The Next Moves, Autopilot
Navigating All Time Highs (6279)


The market doesn’t care about opinions—it only responds to price.
At all-time highs, there’s always a temptation to call the top. To anticipate the reversal. To lean against strength. Noticing the cracks is part of the job as a market participant— acting on them too early is not.
The S&P 500 ended last week at new all time highs. Breadth is expanding. Risk-on proxies like ARKK and IWM are setting up breakouts. My risk-off framework shows zero active signals.
This is the kind of tape you respect—not argue with.
If you’re bullish, your role is simple: stay with the trend, manage risk with price—not with emotion—and protect the line that matters. For now, that line is 6100.
The message hasn’t changed: strength gets the benefit of the doubt, at least until price gives us a reason to think otherwise.
In the sections that follow, I’ll lay out the charts and signals that matter most right now. If this helps guide your process each week, consider subscribing to get the full view—every Sunday to prep for the week ahead, and a brief midweek update each Wednesday.
Risk Off Criteria: 0 of 3 Active
The three risk off criteria of trend, breadth and momentum are absent.
Each week, I assess the market using three core signals that define the broader environment as either risk-on or risk-off. When all three are triggered simultaneously, it sets off the "alarm."
Here is the status as of last week’s close:
Trend — The S&P 500 remains well above its 20-day EMA. Pullbacks toward this range are viewed as healthy within a strong uptrend.
Breadth — Net new highs outpaced new lows across the NYSE and Nasdaq all week, marking the strongest breadth reading since November 2024.
Momentum — The Percentage Price Oscillator (PPO) has turned back upward, confirming strength.
With 0 of 3 signals active, the risk-off alarm remains silent—and the backdrop remains bullish.

There is a story in the histogram. The risk-off score has remained low since April 24, the same day the S&P 500 reclaimed its short-term moving average. That trend has carried upward into July. And since June 26, all three criteria have again remained off. Until that changes, the trend stays with the bulls.

Sentiment & Positioning
Both sentiment and equity positioning shifted meaningfully last week. The CNN Fear & Greed Index closed at 78—Extreme Greed—its first such reading in over a year. While that level reflects elevated optimism, the market can sustain this type of sentiment for extended periods. For me, this isn’t an automatic “sell greed” moment.

On the positioning side, active fund managers ramped up exposure as the S&P 500 pushed to new all-time highs, with the NAAIM exposure index hitting 99—for me, the start of “extended” territory.

Historically, the combination of extreme sentiment and high equity exposure has often marked local tops. In the S&P 500 chart below, I’ve annotated past peaks with corresponding sentiment and positioning levels to show this relationship. As always, no signal is perfect in isolation:
December 2023 stands out as a moment where “buying greed” worked,
While July 2024 and February 2025 saw local tops despite neutral sentiment.
My read at this point: We’re back in an environment that has a solid track record of aligning with local tops.

Navigating The Short Term— Key Levels Into Next Sunday
With no technical overhead resistance yet established, the market sits in open air. From here, I see three broad scenarios on the table:
A moderate rise to new highs — targeting the 6300–6500 range
A euphoric melt-up toward 7000
A broad consolidation of the April–July rally — with potential downside extending as far as the long-term moving average near 5750
The first two represent a bullish path forward and benefit current positioning. The third scenario is one I expect unfolds when the risk-off framework trigger the alarm.

In the meantime, here are the key short-term support levels I’m watching—each deserving the benefit of the doubt:
6147 – The most recent all-time high. A retest here would be a natural and healthy development within trend.
6060 – The current 20-day EMA and the breakout level that launched the most recent leg higher.
Pullbacks to either zone = buyable under current conditions.
6000 – A major psychological and structural level that continues to act as macro support.
Pullbacks to 6000 = buyable, unless breadth and momentum deteriorate (a low probability scenario where 6000 avoids triggering both breadth and momentum)
Upside bias remains toward the 6300–6500 zone, especially if sentiment and positioning stay elevated through July.
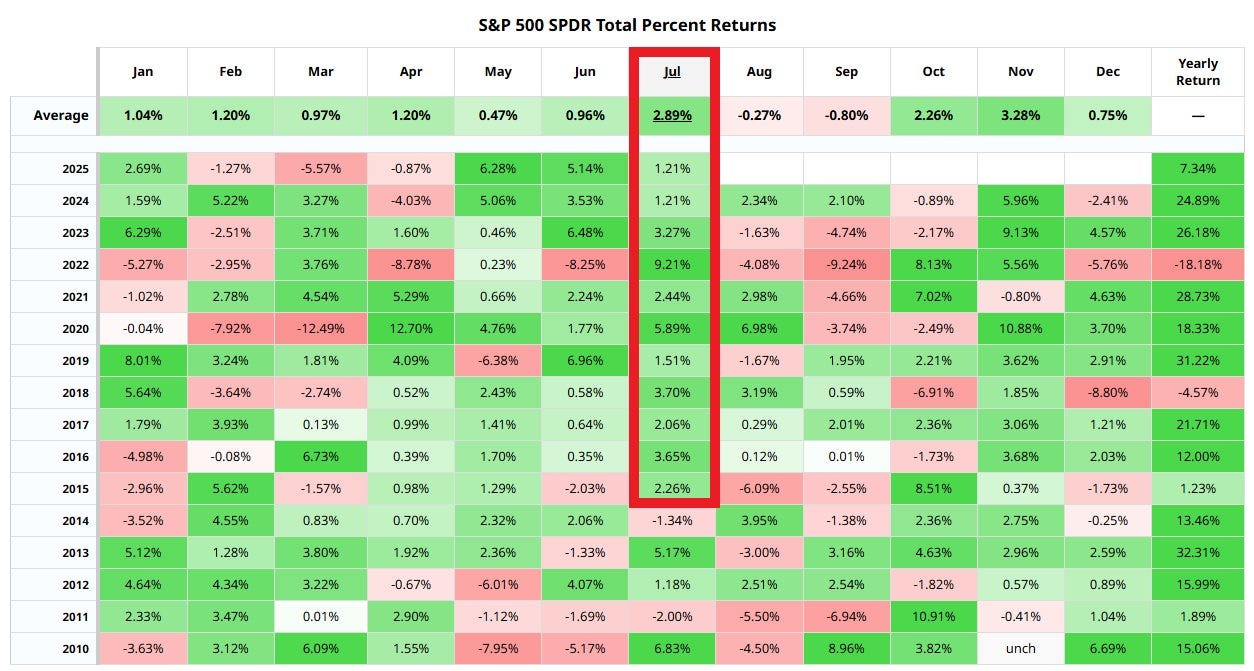
Food for thought: Barchart shared a seasonal return table for the S&P 500—the index has closed green every July since 2015, with the only drawdowns since 2010 being minor. If seasonality holds, bulls may have a few more weeks to ride trend strength—while staying alert for early signs of topping through structure, sentiment, and narrative shifts.
Risk On Barometers— ARKK & IWM
ARK Innovation ETF (ARKK)
The ARKK trade continues to deliver on its expected outperformance and is now positioning for another breakout. Price remains firmly above the key 65 breakout zone.
Add exposure on or near a retest of 65
Revised risk level: 61, aligned with the medium-term moving average—this is the on/off switch for the trade from here
Target range: 90–$100 in a broader bullish scenario

IWM - Russell 2000 ETF
The small-cap barometer is holding above 212, and currently trades in the 225 range—a zone with notable price memory from 2021–2022 and mid-2024.
This area also marks the initial breakdown zone from earlier this year. Holding above 225 strengthens the bull case and supports the idea that risk appetite is expanding beyond large caps.

Bonds (20+ Year Treasury Bond)
No major changes in bond positioning this past week.
I have maintained a 20% allocation to long bonds, and my stance remains the same: the bond market continues to offer an attractive opportunity to build a defensive posture.

Summary Outlook
Last week’s note introduced the idea of the “autopilot position”—maintaining long exposure until the data changes. That remains the playbook. A shift in outlook would require either a confirmed risk-off alarm (3/3 signal) or a stretch in sentiment and equity positioning extreme enough to mark a likely top.
This week’s analysis continues to lean bullish. The levels that would challenge the trend—starting around 6080—remain roughly 3% below current prices. From a risk/reward standpoint, this is not an ideal spot to initiate new long exposure, but it remains a constructive zone to manage existing positions.
Strategy Updates— Immediate Term
Key Bullish Criteria:
Shopping Zone: Pullbacks toward the short-term moving average (~6080)
Risk-Off Signals: 0 of 3 currently active
Risk-On Trade: Long ARKK, holding above 61; exit on breakdown below
Individual Positions: Long LULU, NVO, TSLA, VSCO, BABA, TCEHY, CPNG, B
Bullish Strength Confirmations:
ARKK above 65, more so on breakout above 71
IWM holding above 225
Bearish Scenarios:
No bearish positioning is considered unless all 3 risk-off signals trigger.
Any short-term weakness is viewed as a corrective pullback within a broader bullish structure.
Bond Exposure: Currently 20%. Flexible to increase to 30% in the second half of the year depending on macro conditions and market behavior
Bottom Line:
The trend remains intact, breadth is healthy, and momentum has turned higher. Until the data changes, the market deserves the benefit of the doubt. This is still a bullish tape—and I remain positioned accordingly.
Disclaimer: The information in this article is for informational purposes only and should not be considered financial advice or a recommendation for any investment. I am not a financial advisor, and the content is not intended to serve as financial advice. It is solely intended to journal thought, ignite more thought and discussion.