


S&P 500: Proceed With Caution
5650-5750 Resistance Block


Readers,
I hope you found value in last week’s inaugural Wednesday note. The goal of this brief midweek update is to bridge the gap between Sunday letters with a <3-minute read focused on short-term navigation. These Wednesday notes will remain free through May and transition to subscriber-only access beginning in June.
With that change, the subscription rate will increase to $28/month in June. Current subscribers will remain at the existing rate. If you’re considering becoming a supporting subscriber, now’s the time—signing up before June locks in the current $22/month rate.
Proceed With Caution
David Rosenberg of Rosenberg Research recently shared a striking observation about the market’s character:
We are living through history. Only 0.25% of the time in the past century has the S&P 500 managed to rise nine consecutive days. A 1-in-400 or 3 sigma event! Guess what? Fully 80% of the time this dynamic happened in recessionary environments … not to mention just ahead of the October 1987 crash! Maybe this “bullish” (manic) move isn’t so “bullish” after all!
Source: David Rosenberg
This recent nine-day rally is historic. But history also reminds us: the strongest, sharpest rallies often occur within bear markets. So the key question becomes—was this simply a relief rally, or the start of a new constructive leg toward all-time highs?
As you’ll see throughout today’s letter, my outlook remains consistent with prior weeks: the S&P 500 is now pressing into a key resistance zone (5650–5750). A rejection here, followed by a return to the recent lows, would represent the most humbling outcome for markets—and the market, as we know, often aims to humble the majority.
Risk Off Criteria: 0/3 Active
Three risk criteria determine the broader market environment in my analysis. This section is shared and updated weekly. When all three criteria are simultaneously triggered— this sets off the “alarm”
The system defines the market environment as either risk-on or risk-off using three key criteria. These criteria are shown in the upper, middle and lower panel of the chart.
Short-Term Trend — Price relative to the 20-day exponential moving average on the S&P 500.
Breadth — The number of stocks making new highs vs. new lows across the NYSE and Nasdaq.
Momentum — Measured using the Percentage Price Oscillator on the S&P 500.
For the second consecutive week, all three risk-off signals remain inactive, allowing consideration for a risk-on environment.
The S&P 500 closed above its 20-day moving average, reestablishing a constructive short-term trend.
Breadth turned positive, technically meeting the trigger criteria. However, it’s worth noting that participation remains concentrated—a broader look reveals a market that is still relatively flat outside a narrow group of leaders.
Momentum has normalized, as expected. What had resembled an overstretched elastic band has now reverted back toward the mean.
Bottom line: with all three criteria absent, the risk environment has shifted—at least temporarily—to one more supportive of bullish participation.

Sentiment & Positioning
The sentiment and positioning segment will be included weekly as the market is being actively monitored for characteristics that support a bottoming process.
Back in April, the combination of extreme fear and reduced equity exposure helped mark the local bottom ahead of the historic rally. This framework will remain a core lens through May, as the potential for a retest of the lows is still on the table for consideration in my speculation.
Sentiment, measured by the CNN Fear & Greed Index, remains in “Fear” territory—though it has notably improved from the extreme reading of 3 that aligned with the April low.

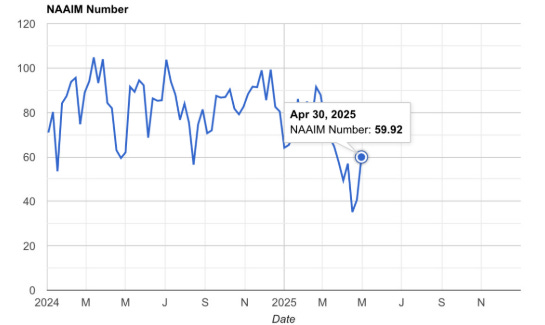
Positioning, tracked via the NAAIM Exposure Index, shows that active fund managers have begun rotating back into U.S. equities as of April 30. This comes after derisking at the bottom—offering a textbook case of how fear often paralyzes even experienced market participants.
Navigating The Short Term— Key Levels Into Next Sunday
As outlined in last week's note, I initiated a position in the "good value" zone (SPY 509.87). With the S&P 500 now pushing into the great profit-taking zone, I’m following the plan and exiting this trade. The market has moved “too much, too fast,” as described last week, offering little opportunity to size up within the shopping zone. That’s trading—rarely perfect, but this turned out to be an excellent +10% index move.
The “Shopping” and “Selling” zones remain unchanged. The strategy stays simple: build long exposure inside the shopping zone, trim and reassess as price enters the sell zone.
Shopping Zone: 4800–5250
5000–5200: Good value
4800–5000: Great value
Sell Zone: 5400–5750
5400–5650: Good profit-taking zone
5650–5750: Great profit-taking zone

The most humbling scenario remains a rejection inside the 5650–5750 zone, leading to a retest of the April lows.

This zone is not to be taken lightly—it has historically acted as a key inflection point.
In July and August 2024, 5650 rejected price sharply.
Later that year, this same level became the breakout springboard into all-time highs.
Most recently, in March 2025, it again acted as resistance.
The S&P 500 is now back at this pivotal range. Rejection here could send the index back toward the April lows. Conversely, sustained closes above 5767 would seriously challenge any remaining bearish case.

5765 — late September all-time high range + consolidation range prior to next series breakout
5650 — low range of September - October 2024 consolidation + prior all time high range from July & September 2024
5483* — short term moving average
Positively last week the index successfully utilize the short term moving average as support. This is a bullish characteristic to weigh against bearish thoughts.
5400 — July & September 2024 pivots
5250 — April 2024 all time high, May 2024 breakout level— anticipated support if breakdown below 5400
4975 — April 2024 low pivot
4800 — 2022 & 2023 all time high range— breakout level that propelled the 2024 rally
Small Caps
Unlike the broader S&P 500 and Nasdaq, both the traditional and modern small-cap segments are telling a different story. These categories remain below key resistance levels and have yet to confirm a breakout—introducing a note of caution to the otherwise bullish market tone.
ARK Innovation ETF
ARKK managed to close above its 50-day moving average last week—a constructive step. However, it remains below the critical multi-year breakout level of 52. For ARKK to fully support a broader bullish advance, it needs to reclaim and hold above that level. Until then, the rally in small caps remains suspect.

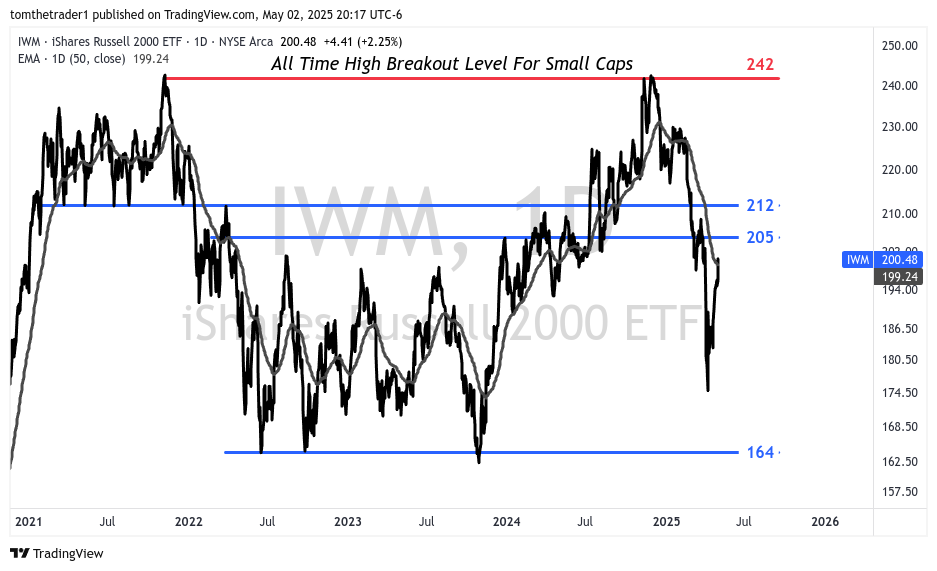
IWM - Russell 2000 ETF
IWM, the traditional small-cap barometer, continues to lag—recovering more slowly than ARKK and meaningfully underperforming the broader market. The ETF remains stuck below the key 205–212 resistance range. A sustained breakout above this zone would strengthen the bullish narrative. Until then, it adds an element of hesitation.
Bonds (20+ Year Treasury Bond)
No major changes in bond positioning this past week.
I have maintained a 20% allocation to long bonds, and my stance remains the same: the bond market continues to offer an attractive opportunity to build a defensive posture.
Earlier this year, I noted that a move above $100 in the 20+ Year Treasury Bond ETF (TLT) would signal risk-off sentiment. That threshold was revised to $90 in January, and TLT continues to trade constructively around that level.

Summary Outlook: Questioning The Rally, Near Term Proceeding With Significant Caution
The recent market rally, in my view, falls into the “too much, too fast” category. As such, I’m entering May with significant caution. I plan to exit the initial S&P 500 position for profit and will look to reestablish long exposure if prices revert back toward the outlined Shopping Zone.
Over the past few letters, I’ve shared a mindset shift—stepping away from short-side trades to focus fully on building a sizable long position. While the current price action near the resistance block is tempting for bearish setups, I remain committed to a bullish outlook and prefer not to test my luck. It’s been a strong year for market outperformance, and that edge is best protected with patience and discipline.
Strategy Updates— Immediate Term
Ending last week I maintained my initial positioning (SPY ETF at 509.87)— the intent is to close this position as price trades in the 5650-5750 range. From there the Shopping Range remains:
Shopping Zone: 4800–5250
5000–5200: Good value
4800–5000: Great value
Bullish Scenarios: Recovery/Relief Speculation & Small Caps
I maintain the speculation that small caps—particularly ARKK—will outperform during relief rallies.
Longer-Term Bullish Criteria:
All risk-off signals turn off.
0/3 risk-off signals active as of market close May 2
Breakouts above 52 (ARKK) and 212 (IWM)
Both ARKK and IWM remain below key breakout levels
Bearish Strategy:
Short S&P 500: Short trading has for now conclude as the focus shifts to accumulating long exposure in the shopping range.
Bond Update: A 20% position is established, with flexibility to scale to 30% through June if conditions warrant.
Bottom Line: Proceeding Next Weeks with Caution— Maintaining A Bullish Mindset To Buy Lows
The bottoming narrative remains intact, and the mindset remains bullish. While the recent rally has been strong, I continue to speculate that a revisit toward the April lows remains possible—and if that occurs, I intend to be a buyer.
And for what it’s worth: Warren Buffett hasn’t been a buyer either. Berkshire Hathaway’s cash pile hit a new record at $147.4 billion, suggesting the Oracle of Omaha is also choosing patience for now.

Disclaimer: The information in this article is for informational purposes only and should not be considered financial advice or a recommendation for any investment. I am not a financial advisor, and the content is not intended to serve as financial advice. It is solely intended to journal thought, ignite more thought and discussion.