Week 1: Monthly Opening Note

Risk-Off Environments
On Thursday, we issued an out-of-cycle note to underscore a significant shift in market conditions: the environment has now shifted to risk-off. This marks the fourth occurrence this year where the alert criteria have been met, signaling caution. The three risk-off indicators, discussed at the beginning of each letter, have consistently acted as reliable signals for near-term declines.
In the past three years, these criteria have triggered 11 times, with each alert coinciding with an average decline of just over 8% over a 21-day trading period.
Looking back further to the “COVID era,” these same criteria were triggered on February 24, 2020, just before the S&P 500 dropped 32% over 20 days as the coronavirus pandemic gripped the market. Later that year, as the 2020 U.S. presidential election approached, the risk-off signals also predicted a 6% decline in September, followed by a sharp 4.5% drop in the week leading up to the election.
The S&P 500 chart below visually represents these instances, with vertical lines marking each instance where all three risk-off criteria were active.
Risk Off Criteria — 3/3 🚨
In my work, three components define the market environment as either risk-on or risk-off.
The Short Term Trend— price relative to the 20-day exponential moving average
Breadth— the number of stocks making new highs vs new lows across NYSE & Nasdaq markets, middle panel “Net New Highs”
Momentum— measured using the Percentage Price Oscillator, lower panel
In October, the momentum indicator alone briefly flashed, serving as an early amber caution. Last week’s letter noted that we had reached 1 out of 3 risk signals, with a specific warning to monitor the 5787 level due to limited room for error. Thursday’s decline set off the full alert, and despite a recovery rally on Friday, all three signals remain active. By this measure, we are officially back in risk-off mode.
Navigating The Short Term
In the short term (daily time frame) there are two levels to actively monitor.
The short term trend (20-day exponential), this is at 5782
5675 - 5650
The index is about 1% away in either direction— prices below 5675 increase the probability of a continued decline whereas trading above the short term trend, 5782 would be cold water on the bearish thoughts.
In the bearish scenario where price fails to find balance in the 5675-5650 range, my speculation is for a decline into 5400 as an initial target.
Small Caps— Above Water
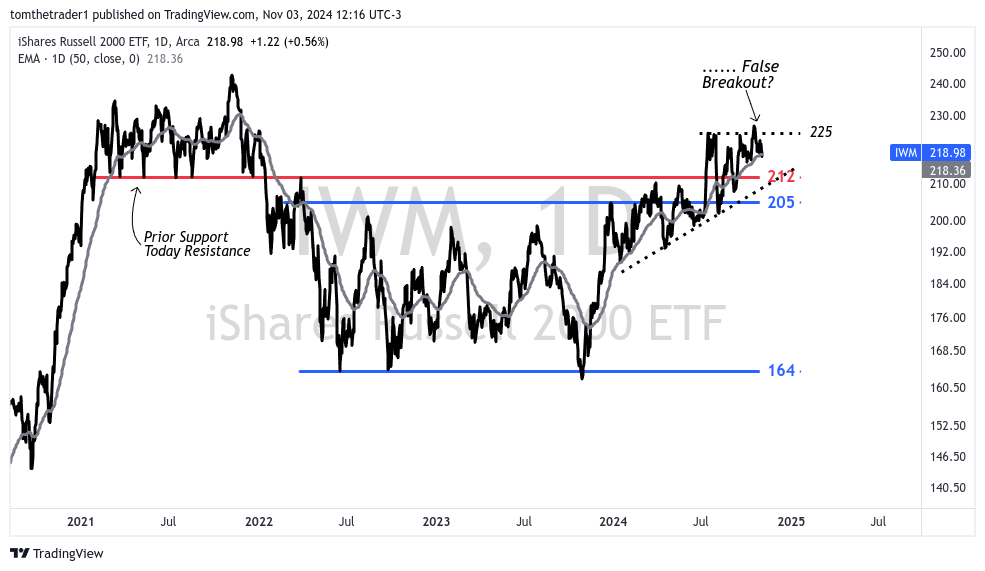
The small caps ended last week holding above water. If there was a doubt to being overly bearish it would be the small cap charts, both modern day (ARKK) and traditional (IWM) categories keep their charts in a long term consolidation.
ARK Innovation ETF
ARKK has maintained above the minimum 45 and the medium duration moving average (50-day exponential). The breakout level remains 52.
IWM - Russell 2000 ETF
The Russell 2000 ETF remains contained to a triangle consolidation, and above the 50-day moving average.
Bonds
The 20-year Treasury Bond (TLT) remains below the key $100 level, and is faltering in a key support zone— failure to sustain above 92 has led to recent breakdowns.
Summary Outlook
This week, my market outlook has shifted to a more cautious stance. I’ve hedged my long exposure with a short position on the S&P 500, targeting a decline to 5400. This hedge will be lifted if we see consecutive closes above the short-term trend level of 5780.
Currently, I lean toward viewing this pullback as a healthy correction rather than a signal of a market top. I don’t believe the recent all-time high marks “the top”—at least, not at this stage.

In the bullish scenario: position overweight long in small cap equities, namely ARKK. Signals for this scenario are the absence of “risk off criteria” in the broader market and a breakout in ARKK and IWM trading above 52 and 212, respectively. The US Small Cap trade idea category through this scenario will gain exposure.
Updates: ARKK positioning remains long, the strategy remains unchanged, closing prices below 45 trigger risk management review
Updates: VSCO in the US Small Cap category hit initial target, returning 45% over 5 months.
In the bearish scenario: position short the S&P 500, and long bonds. Signals for this scenario is when all three risk-off criteria are simultaneously triggered— and long bonds becomes favored when TLT (iShares 20+ Year Treasury Bond ETF) trades above 100.
Heading into the week of November 4 the bearish scenario is on.
Trade Ideas
All three category trade ideas: US Small Cap Equities, Outside US Equities, and The Gold Trade were updated in last week’s letter. The updates remain relevant into the coming week—details here.
Disclaimer: The information in this article is for informational purposes only and should not be considered financial advice or a recommendation for any investment. I am not a financial advisor, and the content is not intended to serve as financial advice. It is solely intended to journal thought, ignite more thought and discussion.


Thanks! But why long bonds in bearish scenario?