


S&P 500: Momentum is Fading
Pause or Pullback


Concluding the week, the S&P 500 recorded a modest gain of +0.21%, while the Nasdaq outperformed with a +0.51% increase, both marking new highs for 2023. The robust recovery observed throughout November extended into the initial week of December.
The following thoughts and charts maintain my own outlook: the market appears stretched in the very near term, making a healthy pullback more likely than an immediate continuation of this rally.
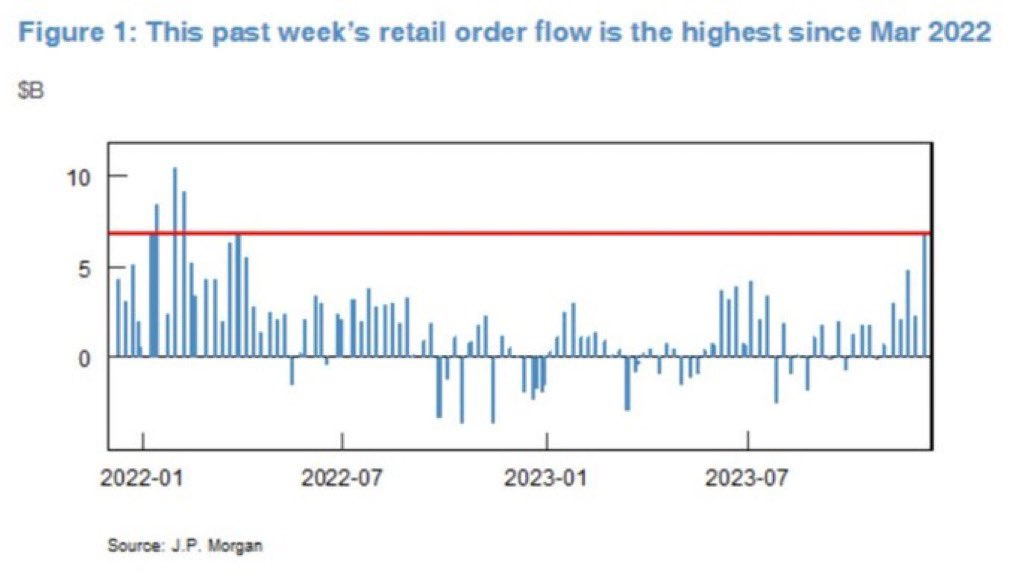
Retail Piles In
This past week J.P. Morgan shared that retail participants bought the most amount of equities since March 2022. There is an almost unanimous consensus that the market will immediately continue higher. I tend to think that retail participants are the last to join the party. It is noteworthy that the last time retail order flow was consistently positive was through July and August before the market progressed into a three month 11% correction.
Positive Breadth
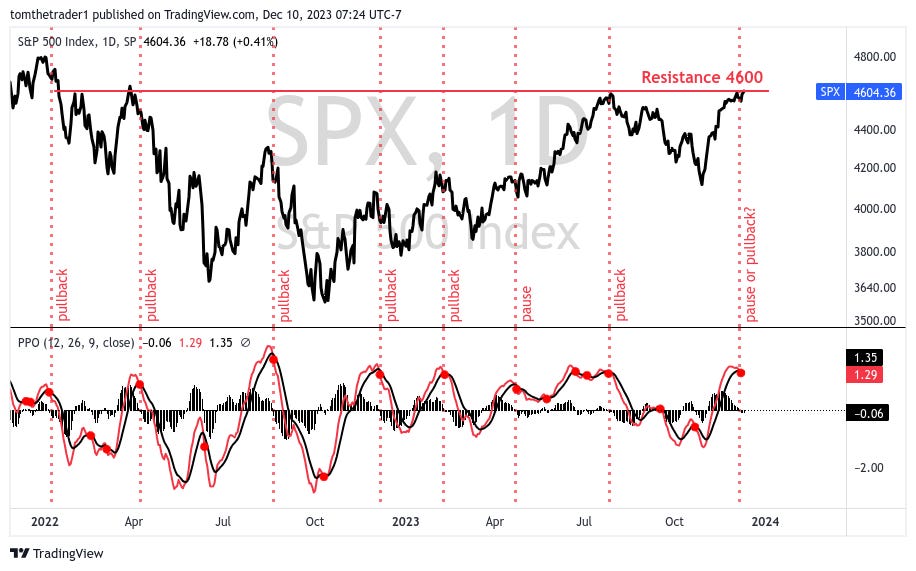
The chart of the S&P 500 is displaying a consolidation phase, as price traded within a 2% range for the past three weeks.
4600 Resistance Pivot: Notably, the 4600 level serves as a visible resistance pivot from both July and March 2022
In the lower panel is Net New Highs, a measure of breadth that shows the difference between the number of stocks making new highs versus the number of stocks making new lows across the NYSE and Nasdaq markets.
Positive Breadth: Breadth is consistently positive, a key feature of successful market advances. This sustained positive breadth leads me to speculate that, following a healthy corrective move, the odds favor a market that continues its upward trajectory well beyond 4600.
Healthy Pullback Scenario: In the event of a healthy pullback, I anticipate a similar outcome to what was observed during the corrections in June and early July, where breadth transitions to a neutral state.

Stuck in Greed
For three consecutive weeks, the CNN Fear & Greed Index has reflected a market operating in greed. This sharp change in sentiment from just a month ago closely parallels the progression observed from March through April earlier this year.

The NAAIM Exposure Index, offering insights into the US equity market exposure among active fund managers, continued to report elevated levels throughout the past week.

The relative highs of both the CNN Fear & Greed Index (highlighted by red arrows) and the NAAIM Exposure Index (marked with blue arrows) provide a valuable perspective on the current market cycle. The observation is simple: Greed and elevated exposure have consistently preceded meaningful turning points in the market. If the recent high for the S&P 500 isn't immediate, this chart strongly suggests it is certainly close.

Momentum Flashing Slowdown
The current momentum in the S&P 500's upward trajectory is flashing at the potential for a pause or pullback in the coming weeks. The lower panel of the chart shows the Percentage Price Oscillator (depicted by the red line). This oscillator gauges the percentage difference between two short-term moving averages, providing insights into the momentum of the prevailing trend. The red dots within the panel signify negative crossover events, characterizing a slowdown in momentum. Over the past two years, these negative crossover events have consistently signaled a pullback or pause. I do not imagine this time will be any different.
Outlook: Still Hedged
My outlook and portfolio positioning remain hedged— I favor the thought that the market is due for a healthy pause or pullback before resuming the uptrend. A healthy pause in my analysis corrects the index towards its medium duration moving average currently at 4450, reflecting a modest 3.5% decline from Friday’s closing price.
The shared thoughts of anticipated outperformance from Cathie Wood’s ARK innovation ETF (ARKK) and the ‘2020 growth’ cohort continued well through last week. As this growth category approaches a resistance level at 52, I've retained my hedge against this outperformance through a Nasdaq short.

In the near term my speculation supports a healthy correction in the major indices, and I think it is unlikely that ARK and similar growth category equities avoid the same pause or pullback. With this very short term thought aside, I remain an advocate for this category to continue to outperform over the coming months. In future issues of this letter, I will expand further into the charts and ideas within my own portfolio that support this speculation.
2024 Reader Supported Publication
I’m excited to share that after December, to start 2024— Lines On A Chart will become a reader-supported publication. By pledging now, you can secure founding rates and maintain the weekly note in your market reading. If you’ve found value in this analysis, please share it with your network and join for weekly updates and meaningful market insights.
Throughout December, the annual rate is discounted by 25%, and the monthly rate by 10%. These founding rates are available to those who pledge before the publication transitions to reader-supported on January 2, 2024.
Disclaimer: The information in this article is for informational purposes only and should not be considered financial advice or a recommendation for any investment. I am not a financial advisor, and the content is not intended to serve as financial advice. It is solely intended to journal thought, ignite more thought and discussion.
Always look forward to your work.. I'm an old MMaker, so i trade flow and sentiment and positioning.. No need for "tickers" just maybe some insight on ,Q's Spy, ITW and Bonds/ Rates. Appreciate your efforts..
Twenty a month for once a week report is a bid much. StockCharts has everything for tech analysis, plus many, many weekly articles on SPX and many other markets. Michael Kramer gives daily reports for free.