


March 2025
There’s a lot to unpack this Sunday as we head into the first trading week of March. Last week’s letter issued the first risk-off signal of the year, and the four key market barometers ended the week as follows:
S&P 500 -0.97% (-1.66% the week prior)
Nasdaq -3.38% (-2.26% the week prior)
Russell 2000 -1.47% (-3.71% the week prior)
Cathie Wood’s ARKK -7.57% (-10.18% the week prior)
In today’s hyper-connected, social media-driven market— risk happens fast. The system I’ve designed is focused on first determining whether the market environment is risk-on or risk-off—a critical distinction in my portfolio management strategy. Each Sunday, I evaluate three key criteria that set the stage for market conditions. When a risk-off signal is triggered, I treat it as non-negotiable.
For New Readers: Understanding the Risk-Off System
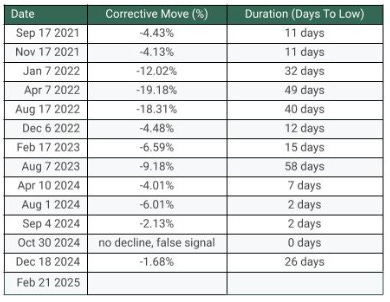
For the new readers joining this week— welcome. (To the regular readers— skip this section and jump right into Sentiment). Over the past three and a half years, these criteria have triggered 13 times, with an average decline of 7.7% over a 22-day trading period. It has consistently proven reliable in signaling risk before broader market declines.
The primary objective of this analysis is to define the market environment, which is why each weekly newsletter begins with an overview of these risk-off criteria.
Risk Off Criteria - 3/3
Three risk criteria determine the broader market environment in my analysis. This section is shared and updated weekly. When all three criteria are simultaneously triggered— this sets off the “alarm”
My system defines the market environment as either risk-on or risk-off using three key criteria.
Short-Term Trend — Price relative to the 20-day exponential moving average on the S&P 500.
Breadth — The number of stocks making new highs vs. new lows across the NYSE and Nasdaq.
Momentum — Measured using the Percentage Price Oscillator on the S&P 500.
The S&P 500 through last week maintained below the short term trend, negative breadth through the entirety of the week, and momentum continues to point downward. The market environment remains as risk-off.

Market Sentiment: A Decline Into Extreme Fear
Market sentiment continued to deteriorate last week, with the CNN Fear & Greed Index registering Extreme Fear. The last time the market was in a state of Extreme Greed was near the conclusion of a 10% corrective move in August 2024.
I continue to find it intriguing that fear is this elevated so early in a decline—it remains a puzzling data point in the current environment.

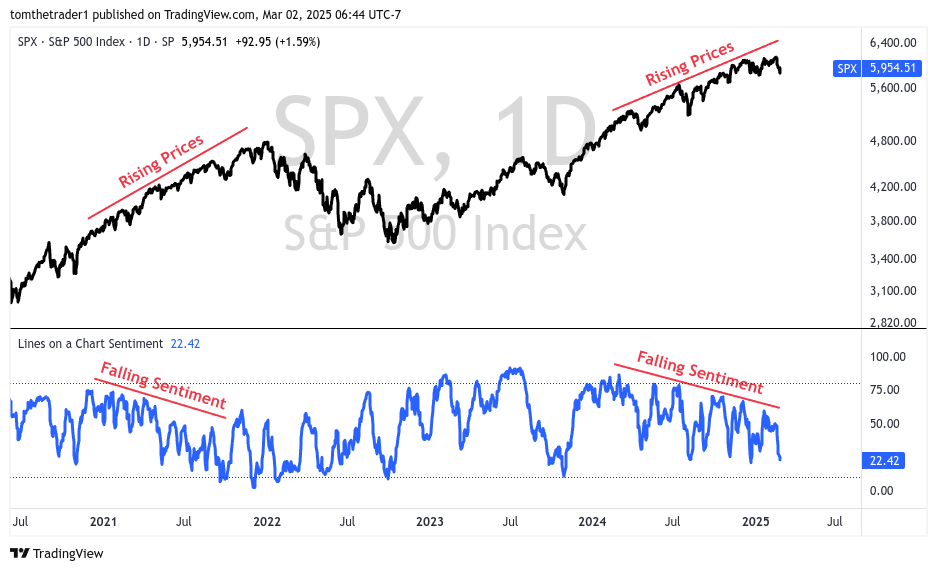
In the lower panel of the chart is a customized representation of sentiment using S&P 500 performance vs bonds, breadth, momentum, general market strength (# of 52 week highs), and market volatility (VIX). The higher the reading the more positive sentiment, the lower the reading the more depressed.
It is an interesting observation that as prices have risen in 2024-2025 following the August through October 2023 decline, the overall peaks in positive sentiment have trended lower.
This same trend was evident during market declines in 2006–2008, 2010 (twice), 2015, and 2021–2022—but notably absent in 2000, 2018, and 2020. This divergence raises questions about the broader implications of sentiment shifts and warrants further analysis.
Navigating The Short Term
There are seven key levels that are actively monitored in the navigation of the short term— the chart below provides a visual to the historical pivots these levels have afforded the market in recent months.

The short term navigation will focus on a series of levels and a potential bearish crossover event. On the conditions that a bearish crossover transpires and rallies are rejected at the key moving average, 5400 becomes an initial target for the decline.
Key Levels Into Next Sunday
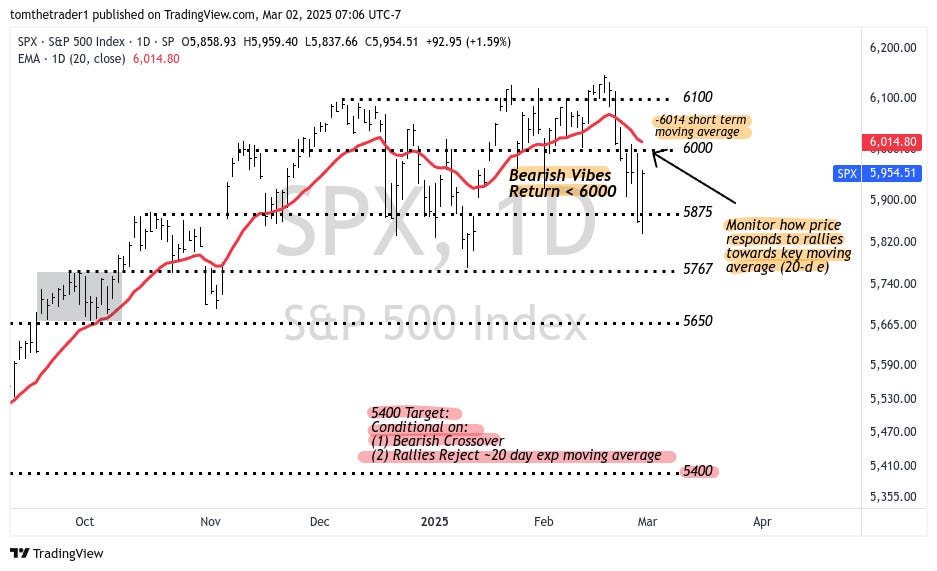
6100 — Breakout territory. Sustained prices above 6100 begin to develop a visual breakout continuation for the index
6014* — short term moving average
Rallies that are rejected at the short term moving average through next week add another degree of risk for a continued decline
Reclaiming the short term moving average is the first step of voiding the risk-off alarm
6000 — Sustaining above 6000 will erase bearishness regardless of media headlines (ie. DeepSeek, Trade Wars, Coronavirus 2.0, Oval Office Interviews, etc)
5875 — represents a previous all time high range, and now a key support level in the scenario for a pullback. Failure to sustain 5875 opens the index for further decline towards 5767
5765 — late September all-time high range + consolidation range prior to next series breakout— the immediate support level if the index closes below 5875
5650 — low range of September - October 2024 consolidation + prior all time high range from July & September 2024
5400 — July & September 2024 pivots. On the conditions that a bearish crossover transpires and rallies are rejected at the key moving average, 5400 becomes an initial target for the decline.
Bearish Crossover— Monitor Through Next Week
The bearish crossover, a risk indicator— this happens when the shorter-term 20-day moving average (in red) crosses below the medium-term 50-day moving average (in black), signaling potential risk.

In analyzing the bearish crossover events of the past, two key observations emerge:
Moderate Scenarios: Corrections typically bottom out near the point of the crossover. This pattern was most recently observed May and August 2024 or in some cases as observed earlier this year in January 2025 the crossover comes close to occurring but doesn’t fully materialize, however the same result is yielded where the bottom of the corrective move has occurred near the potential crossover point
Severe Scenarios: Prices continue to decline, with any rally attempts encountering resistance at the short- and medium-term moving averages.

Small Caps— Equally Showing Risk
ARK Innovation ETF
While Cathie Wood’s ARKK still holds the potential for a multi-year breakout, last week’s failure to sustain above the 50-day moving average prompted a pause in the trade, as noted in the previous letter. Active readers will recognize this moving average as a key risk management level for the melt-up trade.

Through last week, ARKK remained below this critical level and is now positioning for a retest of the 52 breakout level—a scenario highlighted in last week’s note. In response, I continued to take profits, significantly reducing exposure to the trade.
I will look to resume growing exposure once:
The broader market risk-off criteria subside, or
ARKK successfully retests 52 as a level of support.
For now, patience remains key.
IWM - Russell 2000 ETF
The traditional small cap category, the Russell 2000 failed to utilize a year long ascending level of support— adding to the risk-off feeling that exists in ARKK and the broader market.

Bonds (20+ Year Treasury Bond)
No changes to Bond context from last week
I am establishing long term bond positioning, with an intent to build a 20-30% allocation— the bond market in my interpretation is creating an opportunity to build a defensive position.
Through most of 2024 I had shared that an advance above 100 in the 20+ Year Treasury Bond ETF (TLT) would act as a signal of risk-off sentiment in U.S. equities— in January this year I revised that level to 90.

Summary Outlook: Elevated Caution
With all three risk signals active for a second consecutive week and continued weakness in the small-cap segment, the outlook shifts to elevated caution.
Throughout last week, I maintained a hedge via a short S&P 500 trade. Moving forward:
This hedge will increase on rejected rallies.
It will be removed if the S&P 500 closes above the short-term moving average on a weekly basis.
As mentioned bond summary over the past month, I am gradually building a material position in bonds. This process is underway as TLT trades above 90.
Bullish Scenario: Melt-Up Speculation and Small Caps
I continue to speculate that small-cap equities—particularly ARKK—will outperform in a melt-up scenario. This scenario is on pause, profits on ARKK have been collected.
Bullish Positioning: Overweight in small-cap equities, focusing on ARKK. Key signals include the absence of risk-off criteria in the broader market and breakouts in ARKK and IWM above 52 and 212, respectively.
Update: ARKK profits collected, monitoring a successful retest of 52 breakout
Hedging Update: Short S&P 500 remains active
Bearish Scenario
In the bearish scenario, the strategy shifts to shorting the S&P 500 and increasing bond exposure. Signals for this scenario include all three risk-off criteria being active, with long bonds becoming favorable if TLT (iShares 20+ Year Treasury Bond ETF) trades above 90.
Bond Update: Establishing 20-30% bond positioning as TLT beings to trade above 90
Short S&P 500: Active as a current hedge, net short upon rejected rallies
As we head into the week of March 3, 2025 the outlook is one of elevated caution.
Disclaimer: The information in this article is for informational purposes only and should not be considered financial advice or a recommendation for any investment. I am not a financial advisor, and the content is not intended to serve as financial advice. It is solely intended to journal thought, ignite more thought and discussion.