


S&P 500: July
First Half Finished


First Half Is In The Books
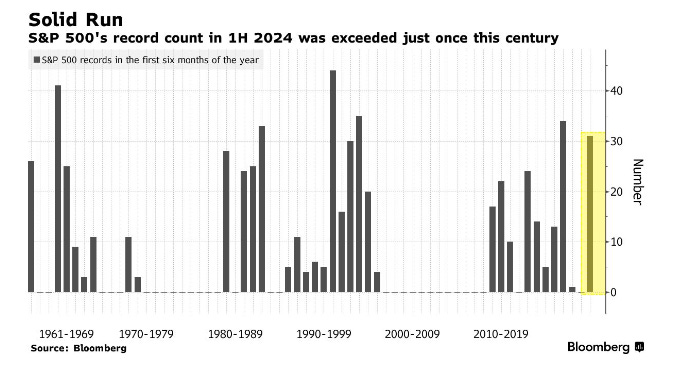
Half of the year is in the books— the S&P 500 is up 14.5% heading into the second half and the Nasdaq 17%. Small caps, however, have not enjoyed the same rally, with the Russell 2000 up a meager 1% and Cathie Wood’s ARKK Innovation ETF down 16%. The S&P 500 recorded 31 fresh all-time highs in the first half of this year, a record count that was exceeded only once this century, as noted by Bloomberg in the chart below:
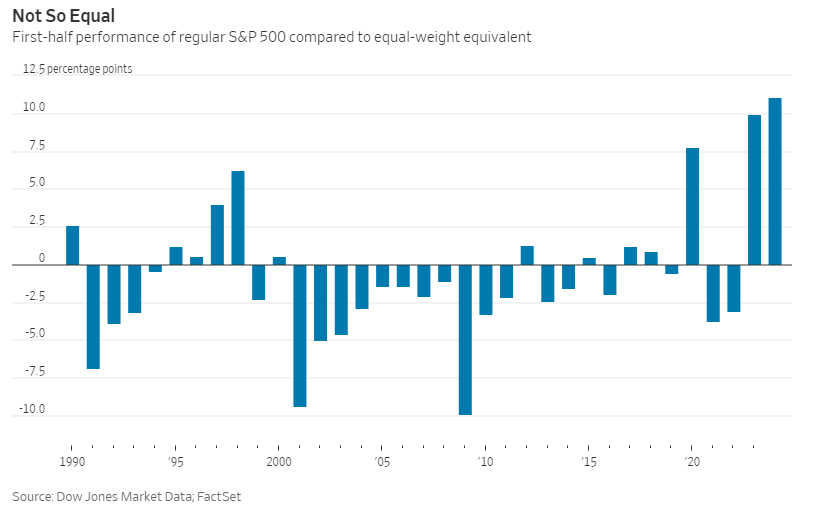
For a month and a half now, the market has consistently closed at or near all-time highs. Under the surface, there are light signals suggesting the rally's stability might be cracking, but these signals are not compelling enough to justify a bearish outlook or positioning. The bull market continues, but I remain mostly a sidelined spectator due to the absence of a ‘risk-on’ character in small-cap equities. The first-half performance comparison between the standard S&P 500 and the equal weight version is stark:
Despite record performance across the general indices, sentiment heading into the second half of the year is starting from a position of fear. It is unusual to have a market at all-time highs and sentiment reflecting anything other than greed. I interpret this as a near-term sensitivity in the market, possibly a byproduct of a concentrated rally that has left most market participants underperforming. I tend to think that a melt-up market top will be met with euphoria and greed— not fear.

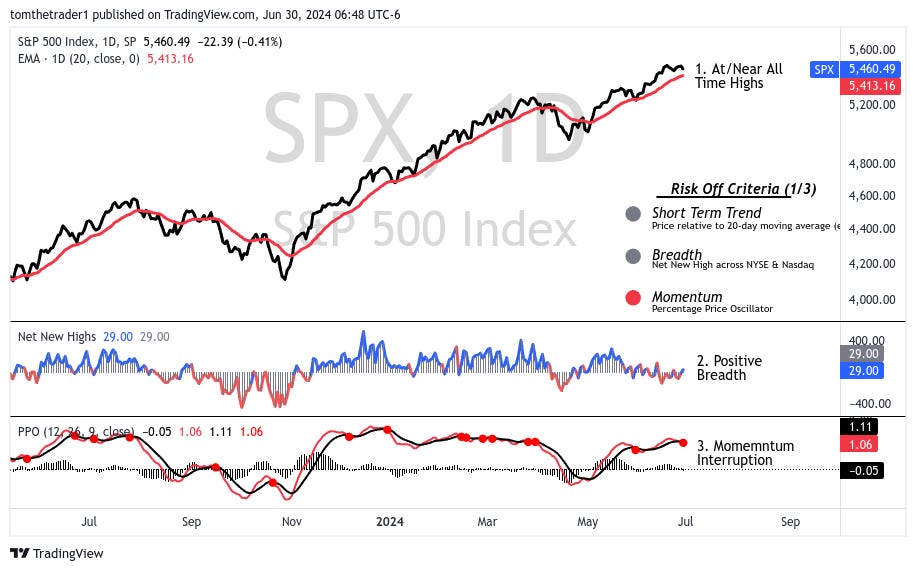
Risk Off Indicators
Every week, three criteria are reviewed to determine whether the market is in a risk-on or risk-off environment. When all three criteria trigger, my analysis considers a decline to be the next most probable move. Until all criteria are active, the market has demonstrated it as unwise to step in front of the bull.
The three criteria monitored weekly are:
The Short Term Trend— price relative to the 20-day exponential moving average
Breadth— the number of stocks making new highs vs new lows across NYSE & Nasdaq markets
Momentum— measured using the Percentage Price Oscillator
Last week ended similarly to the past month, with only one risk-off criterion signaling—insufficient to trigger any market warning. The slight difference last week was that it was the negative momentum signal that was active— not the end-of-week breadth performance.
Absent Risk On Participation
A recurring thought shared throughout the first half of this year has been that small-cap participation is a key component for the market to enter a melt-up stage rally. I still hold this view, and currently, this entire category remains absent from participating.
ARKK Innovation ETF
The ARKK Innovation ETF is my preferred ‘modern day’ risk-on barometer. The risk-on character begins with consistent trading above 45, but more importantly, a breakout above 52.

IWM - Russell 2000 ETF
The Russell 2000 ETF serves as a more traditional risk-on barometer. A breakout above 212 is needed to indicate a bullish character.

Summary Outlook
My market outlook for index positions remains straightforward:
Bullish: When small-cap categories signal risk-on with ARKK above 52 and IWM above 212.
Bearish: When the three risk-off criteria simultaneously signal.
Until one of these scenarios occurs, my index positioning remains sidelined.
Regarding the trade ideas shared this year:
The entire US Small Cap Equities trade category remains limited to initial exposure due to lack of performance.
Outside of US Equities is a bright spot.
The Gold Trade remains stable.
All three trade categories were updated in last week’s letter— details here.
Disclaimer: The information in this article is for informational purposes only and should not be considered financial advice or a recommendation for any investment. I am not a financial advisor, and the content is not intended to serve as financial advice. It is solely intended to journal thought, ignite more thought and discussion.
Interesting: melt up scenario finished with severe correction. All three risk off criteria activated finished with best week in 2024. Something wrong with analysis