

S&P 500: Fishy February
S&P 500: Fishy February
Unfavorable seasonality ahead


After achieving a record the previous week with positive closes in 14 out of 15 weeks, the S&P 500 experienced a downturn this past week. It marked only the second negative close since the beginning of the year, with the previous occurrence in October 2023.
Subsequently, an out-of-cycle letter was dispatched to subscribers mid-last week, alerting them to the initiation of the correction criteria. In this letter, we will reassess the status of all three criteria.
A Fishy February
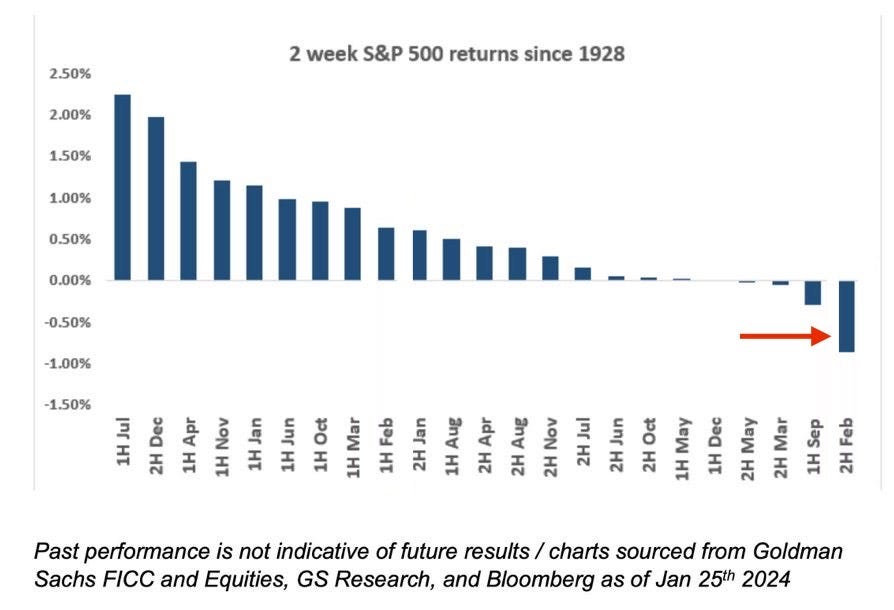
The upcoming two weeks historically haven't favored the S&P 500. Looking back to 1928, the latter part of February typically registers as a period of underperformance. If there were ever a time for a corrective move to materialize, it would be now, aligning with seasonal trends.
Last Tuesday, the market experienced a brief spell of panic, with the S&P 500 dropping as much as 2% and the Nasdaq 2.25%, triggered by the Consumer Price Index (CPI) data coming in above expectations, indicating higher-than-anticipated inflation. While this note doesn't delve into debating the CPI's significance, it underscores the present sensitivity in the market.
Some may argue that the CPI data was inconsequential, given the market's subsequent recovery through Wednesday and Thursday. However, I'm inclined to disagree with this notion. Instead, I see the recovery as a symptom of prevailing complacency among market participants.
As we head into the upcoming week, it's crucial to recognize that the market has been steeped in a state of greed for three months, with the last two veering towards extreme greed. In the advanced stages of a rally, particularly one of record proportions like the one we've witnessed since November, the allure of greed and euphoria can obscure rational judgment. Don’t get lost in the euphoria.

Unlock the full note every Sunday and receive out-of-cycle updates whenever key market criteria are triggered, along with trade ideas targeting to capture potential outperformance. Upgrade your subscription today with monthly and annual options available.
Moments of Bad Breadth
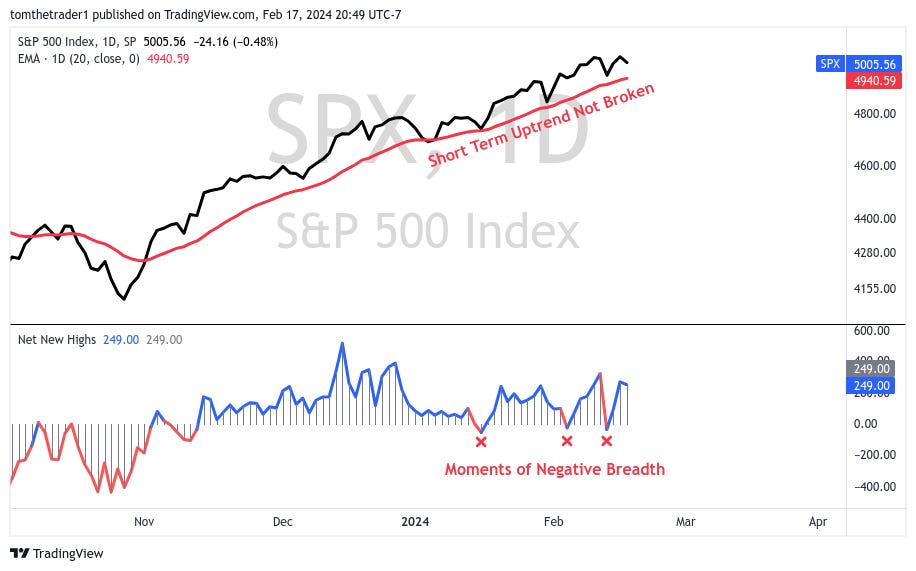
Throughout this year, except for three marked instances, market breadth, as measured by Net New Highs, has consistently remained positive and the short-term trend, represented by the 20-day moving average has provided support for the S&P 500.
Net New Highs is my preferred measure of market breadth. This method records the difference between the number of stocks making new highs and the number of stocks making new lows across the NYSE and Nasdaq markets.
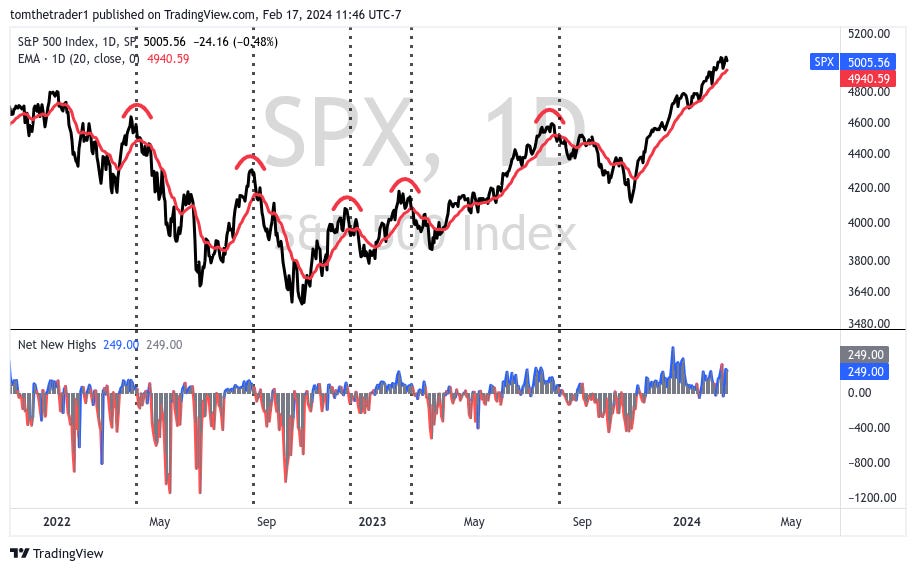
While analyzing breadth standalone may not provide significant forward insight, when coupled with the short-term moving average, it offers valuable perspective. The chart below illustrates this combination, with dotted black vertical lines marking periods when (1) price falls below the 20-day moving average, signaling the loss of the short-term uptrend, and (2) breadth turns negative. This dual criterion consistently precedes meaningful market declines, underscoring the importance of these fundamental measures in my analysis.
So while the market has evaded three potential moments so far in 2024 where breadth turned positive and the short term uptrend remained in tact— the seasonal backdrop through the remainder of February and the nearby proximity of the short term moving average currently at 4940 make this a relatively quick criteria to see triggered.
Looking into next week, Nvidia's earnings on Wednesday after the market close will be a significant event to monitor, given its leadership in the AI sector and the prevailing euphoric sentiment surrounding it.
In the rest of this weekly note, I'll delve into the status of the market correction criteria, provide updated on the two categories of trade ideas previously shared, and introduce a new trade position initiated at the end of last week.