
S&P 500: Continuation
Selective Shopping


Following a breakout the previous week, the S&P 500 not only retained its strength but exhibited underlying improvements— positioning my analysis to favor a continued advance. The index closed up +2.2% for the week, and most notably breadth is finally supporting the advance. Positive breadth has underpinned the best market rallies over the last two years.
The charts that follow capture my thoughts on the potential trajectory for a continued advance, the market components I am monitoring to sustain this outlook, and areas in the market I am speculating outperformance.
Breadth is Back
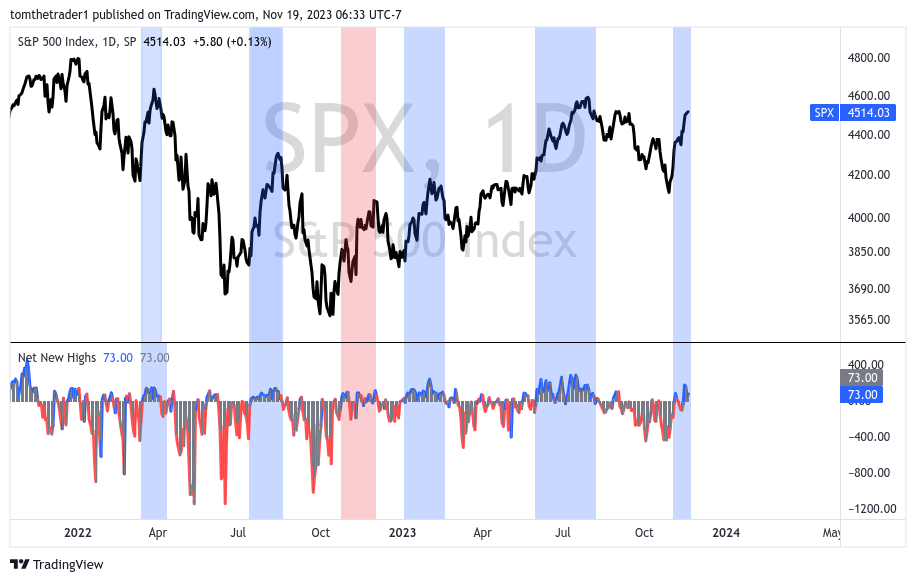
After three and a half months breadth as measured by Net New Highs is again delivering successive positive readings. New New Highs represents the difference between the number of stocks making new highs and the number of stocks making new lows across the NYSE and Nasdaq markets. This is my preferred measure of breadth and is shown in the lower panel of the chart.
The updated chart of the S&P 500 below, carried over from last week, identifies six instances where breadth (Net New Highs) stayed positive. Blue shading highlights segments of market advances that were supported by successive positive breadth, while the rally shaded in red, despite mostly positive breadth, is less obvious when compared to other market rallies. The best rallies over the last two years have been supported by positive breadth.
Greed Is Also Back
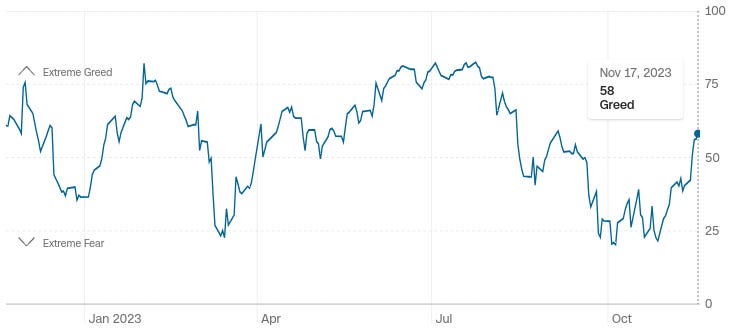
An unmistakable and meaningful change observed in the market last week is sentiment. According to the CNN Fear and Greed Index, market sentiment has transitioned from two and a half months of fear to a current state of greed. In my view, these initial stages of greed often provide support for market advances. It is typically in the later stages of extreme greed where markets tend to pivot.
Favoring Continuation
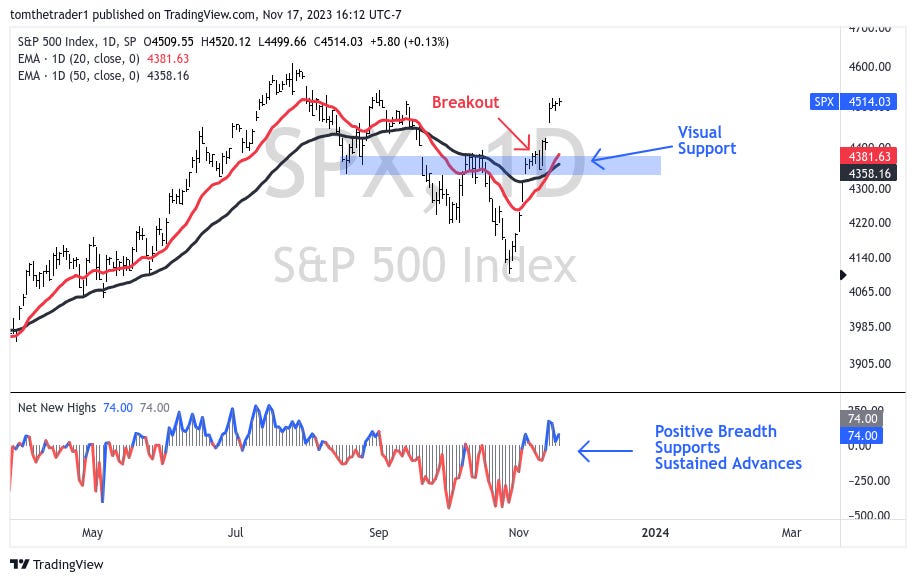
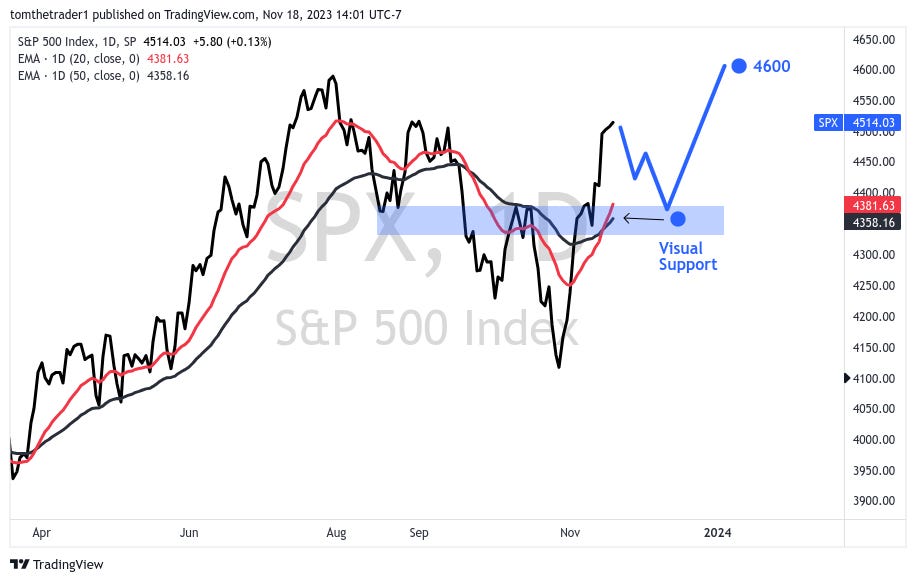
Two weeks ago this newsletter wrote: 'How this chart resolves over the next two weeks will be most telling in determining whether we are witnessing the conclusion of the correction or just another relief rally.'
After two weeks, the S&P 500 has not only traded above the 4300 resistance but has also moved back above the short-term (20-day, red) and medium-term (50-day, black) moving averages, with breadth now supporting the advance. In my analysis, the odds favor that the correction has concluded, positioning this rally favorably for continuation.
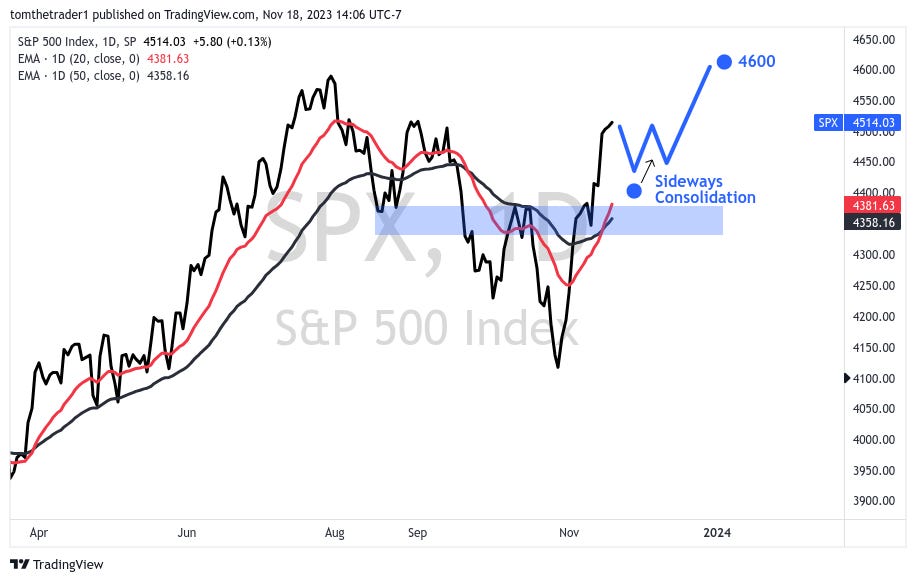
After such a strong rally, a pause or pullback will be a welcomed sign of health— In the near term (6-8 weeks), I am contemplating two potential scenarios.
Scenario Pause
In the scenario of a pause, the S&P 500 consolidates the recent rally by trading sideways.
Scenario Pullback
In the pullback scenario, the S&P 500 tempers the rally with a retracement, bringing the price back near the breakout level (4400).
In both scenarios, simple conditions act as checks on the speculation:
Positive breadth persists
The S&P 500 maintains trading above 4300
The S&P 500 stays above the medium-term moving average (50-day exponential) during corrective moves
As a first stop, I am speculating the S&P 500 to advance to the 4600 summer highs. I intend to increase index exposure on pullbacks that temper this 10% rally.
Finding Outperformance
In July, this newsletter outlined a selection of individual ideas that captured my interest for long sided trades after the euphoria faded and the S&P had undergone a correction. With some patience, that has happened.
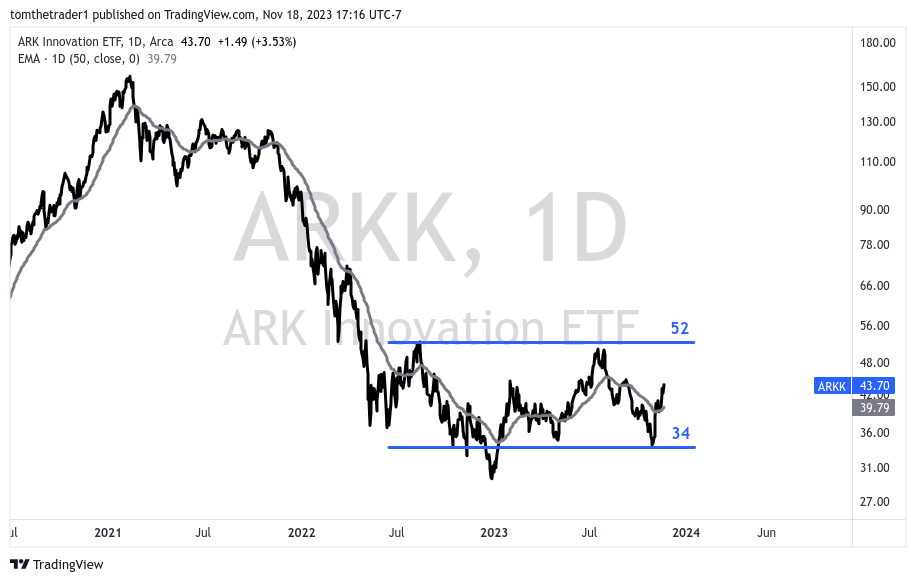
I am speculating outperformance from the '2020 era high-growth names.' Many of these companies that are left have spent the last year and a half consolidating from severe declines. This category is well represented by Cathie Wood’s ARK Innovation ETF (ARKK). ARKK has progressed through a period of wide consolidation with substantial range (34 to 52) for a period of a year and a half.
Today ARKK is trading above the medium duration moving average. This trendline marked the breakouts in January and May. I think as long as price remains above this moving trend it is heading towards the 52 resistance. From there the trade can evolve into a breakout above 52.
To support this speculation in my own portfolio over the course of the past three weeks I have moderately increased my long exposure to the ARKK ETF, PayPal, Unity Software, Snapchat, Figs and Adyen.
Reader Supported Publication
I’m excited to share that in December— Lines On A Chart transforms into a reader-supported publication. By pledging now, you can secure founding rates. If you’ve found value in this analysis, please share it with your network and join for weekly updates and meaningful market insights.
Disclaimer: The information in this article is for informational purposes only and should not be considered financial advice or a recommendation for any investment. I am not a financial advisor, and the content is not intended to serve as financial advice. It is solely intended to journal thought, ignite more thought and discussion.
Excellent write-up.