


Risk Management Matters
The close of trading on Monday marks the end of Q1 2025. Year-to-date, the S&P 500 is down 5%, and the Nasdaq 100 has declined just over 8%.
Back on February 21, the system behind this newsletter issued its first risk-off alarm of the year. Two weeks ago, I ran a reader poll—and I’m pleased to share that over 70% of respondents found the signal helpful.

While risk management may not always be the flashiest market content—it’s the foundation of long-term portfolio protection.
In the letters that followed the February alarm, we began discussing the setup for a relief rally, as price action began stabilizing from the sharp decline. That bounce has since unfolded over the past two weeks.
Each March note emphasized that this rally would help frame two primary scenarios:
A continued S&P 500 decline toward 5200–5400, or
That March 13 may have marked “the low”, signaling the start of recovery and cooling bearish sentiment
This weeks letter will as always core to it’s purpose review the risk management environment, share thoughts on navigating the short term into next weeks letter, and touch on the message small caps and bonds are adding to the environment.
Lines On A Chart is a reader-supported publication. This first letter of the month is free to all.
If you’ve found value in the weekly insights, consider becoming a supporting subscriber to receive:
Every Sunday letter
Out-of-cycle risk alarms
End-of-month trade updates
Risk Off Criteria - 3/3
Three risk criteria determine the broader market environment in my analysis. This section is shared and updated weekly. When all three criteria are simultaneously triggered— this sets off the “alarm”
The system defines the market environment as either risk-on or risk-off using three key criteria. These criteria are shown in the upper, middle and lower panel of the chart.
Short-Term Trend — Price relative to the 20-day exponential moving average on the S&P 500.
Breadth — The number of stocks making new highs vs. new lows across the NYSE and Nasdaq.
Momentum — Measured using the Percentage Price Oscillator on the S&P 500.
Ending last week:
The S&P 500 close below its short-term trend, with rejection happening in this range Monday through Wednesday
Breadth remained negative through the entire week
Momentum curled upwards as anticipated through last weeks note adding fuel for a relief rally, ultimately still remaining negative
For a sixth consecutive week— the market remain environment remains as risk off.

Navigating The Short Term— Key Levels Into Next Sunday
The target for a corrective low has been shared as 5250 - 5400, a range that remained conditional on two developments— both of which after last week are confirmed.
Bearish crossover confirmation (confirmed as of March 5)— this represented the short term moving average crossing below the medium (20 day below 50 day)
A rejected rally at key moving averages (confirmed as of March 26)
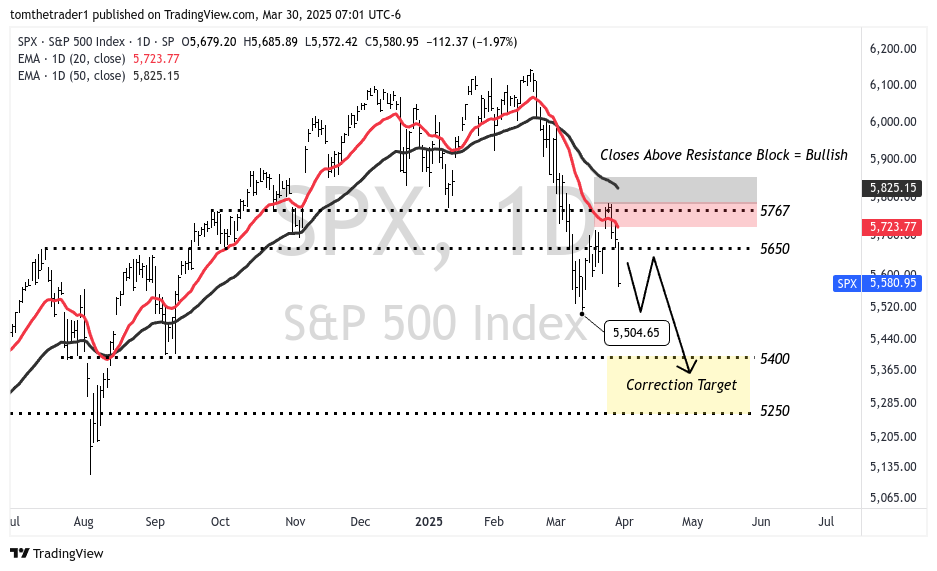
With both conditions now met, a decline toward 5250–5400 becomes the most probable scenario in my analysis heading into next week.

6100 — Breakout territory. Sustained prices above 6100 begin to develop a visual breakout continuation for the index
6000 — Sustaining above 6000 will ease bearishness regardless of media headlines (ie. DeepSeek, Trade Wars, Coronavirus 2.0, Oval Office Interviews, etc)
5875 — represents a previous all time high range, now aligned with the medium duration moving average **(soon to be 5765 in a continued decline scenario)
5765 — late September all-time high range + consolidation range prior to next series breakout, now aligned with the short term moving average **(soon to be 5650 in a continued decline scenario)
5723* — short term moving average
Rallies that are rejected at the short term moving average add another degree of risk for a continued decline
Reclaiming the short term moving average is the first step of voiding the risk-off alarm
5650 — low range of September - October 2024 consolidation + prior all time high range from July & September 2024
5400 — July & September 2024 pivots
5250 — April 2024 all time high, May 2024 breakout level— anticipated support if breakdown below 5400
There are two primary paths in consideration— both which become invalidated with consistent weekly closing prices above the resistance block (>5850)
Scenario A: Another Visit To The Resistance Block
One possibility is a revisit of the 5750–5850 resistance block. If the market pushes above the March 25 high (5786), it may initially appear as a breakout—but the more important factor will be how price behaves around the two key moving averages.
In this scenario, I’ll be watching closely for signs of rejection at those levels, which would signal a false breakout rather than a true trend shift.

Scenario B: Lower Highs, Lower Lows
The second scenario is more straightforward— rally attempts fail to break recent highs, forming a lower high, and the market resumes a standard corrective move toward the 5250–5400 target range.
Both scenarios suggest the near-term environment is likely to remain choppy and difficult to navigate.
Scenario C: Consistent Closes Above Resistance Block
The scenario that eases bearish vibes is one that delivery consistent closing prices at the upper range of the resistance block > 5850
Small Caps
Both the traditional and modern day small cap barometers are adding to the “risk off” message.
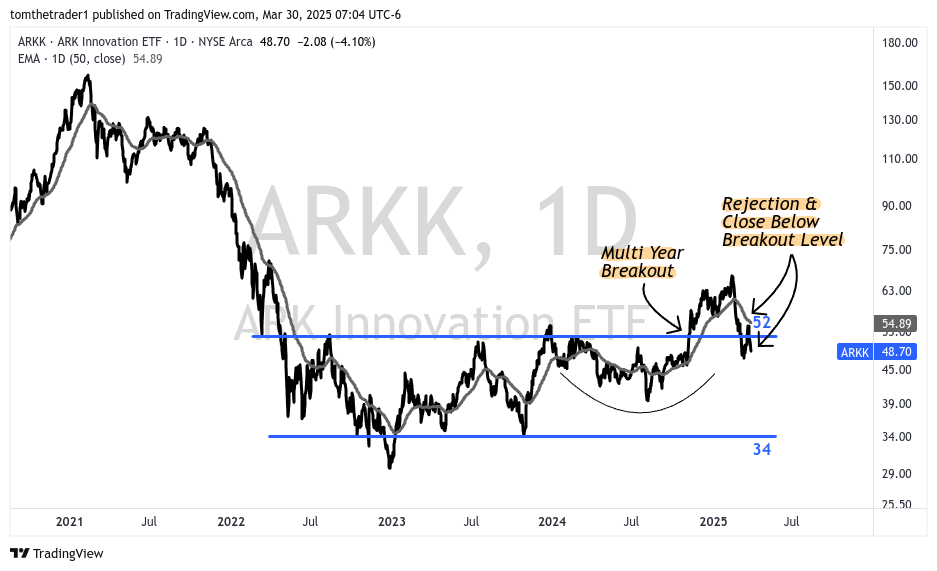
ARK Innovation ETF
ARKK continues to trade below its 50-day moving average, and through last week was characterized by a soft rejection at the 50-day moving average and more importantly closed below the prior 52 breakout level— this performance creates genuine caution for not only the small cap category but a message that should be in consideration for the broader market.
IWM - Russell 2000 ETF
The traditional small cap barometer, the Russel 2000 (IWM) remains below the 2024 breakout level with overhead resistance at the 205-212 breakout range. The same message as ARKK.

Bonds (20+ Year Treasury Bond)
No changes to Bond context from last week
I have continued to establish long term bond positioning, with an intent to build a 20-30% allocation— the bond market in my interpretation is creating an opportunity to build a defensive position.
Through most of 2024 I had shared that an advance above 100 in the 20+ Year Treasury Bond ETF (TLT) would act as a signal of risk-off sentiment in U.S. equities— in January this year I revised that level to 90.

Summary Outlook: Decline Target 5250 - 5400
The market remains in a risk-off environment, with all three risk-off criteria still active as of last week. The anticipated relief rally has played out—and was promptly rejected at the identified resistance block. This outcome shifts the probabilities towards a continued decline toward the 5250–5400 target range.
Strategy Updates
With the relief rally failing at resistance, I plan to build short exposure into rejected rallies near the key moving averages, targeting a move to the 5250–5400 zone.
Bullish Scenario: Melt-Up Speculation & Small Caps
I continue to speculate that small-cap equities—particularly ARKK—will outperform in any melt-up scenario. However, with ARKK remaining below 52, the immediate consideration is on monitoring how price responds near the medium duration moving average (~55). At present there has been a soft rejection— the bullish consideration is on a significant pause.
Bullish Positioning Criteria:
Absence of all three risk-off signals
Breakouts above 52 (ARKK) and 212 (IWM)
Hedging Update:
Actively monitoring rallies into resistance (key moving averages) to trade short positions on the S&P 500
Resistance Block: 5725–5850 remains the primary decision zone
Bearish Scenario
In the bearish scenario, the strategy shifts to shorting the S&P 500 and increasing bond exposure. Signals for this scenario include all three risk-off criteria being active, with long bonds becoming favorable if TLT (iShares 20+ Year Treasury Bond ETF) trades above 90.
Bond Update: Establishing 20-30% bond positioning as TLT continues trade above 90
Short S&P 500: Short S&P 500 on rallies rejecting at the key moving averages “resistance block”
The outlook points towards elevated caution for bullish participants— continued rejection at relief rallies will further add weight to bearish scenarios.
Bottom Line: The Best Of The Relief Rally Likely Over
While another short-term bounce remains possible, the initial rejection at the resistance block is telling. Until proven otherwise, the probability now favors a deeper corrective move, and I intend to trade accordingly.
Disclaimer: The information in this article is for informational purposes only and should not be considered financial advice or a recommendation for any investment. I am not a financial advisor, and the content is not intended to serve as financial advice. It is solely intended to journal thought, ignite more thought and discussion.