
Navigating the Markets
Technical indicators point the market lower

Rates Hikes and the Stock Market
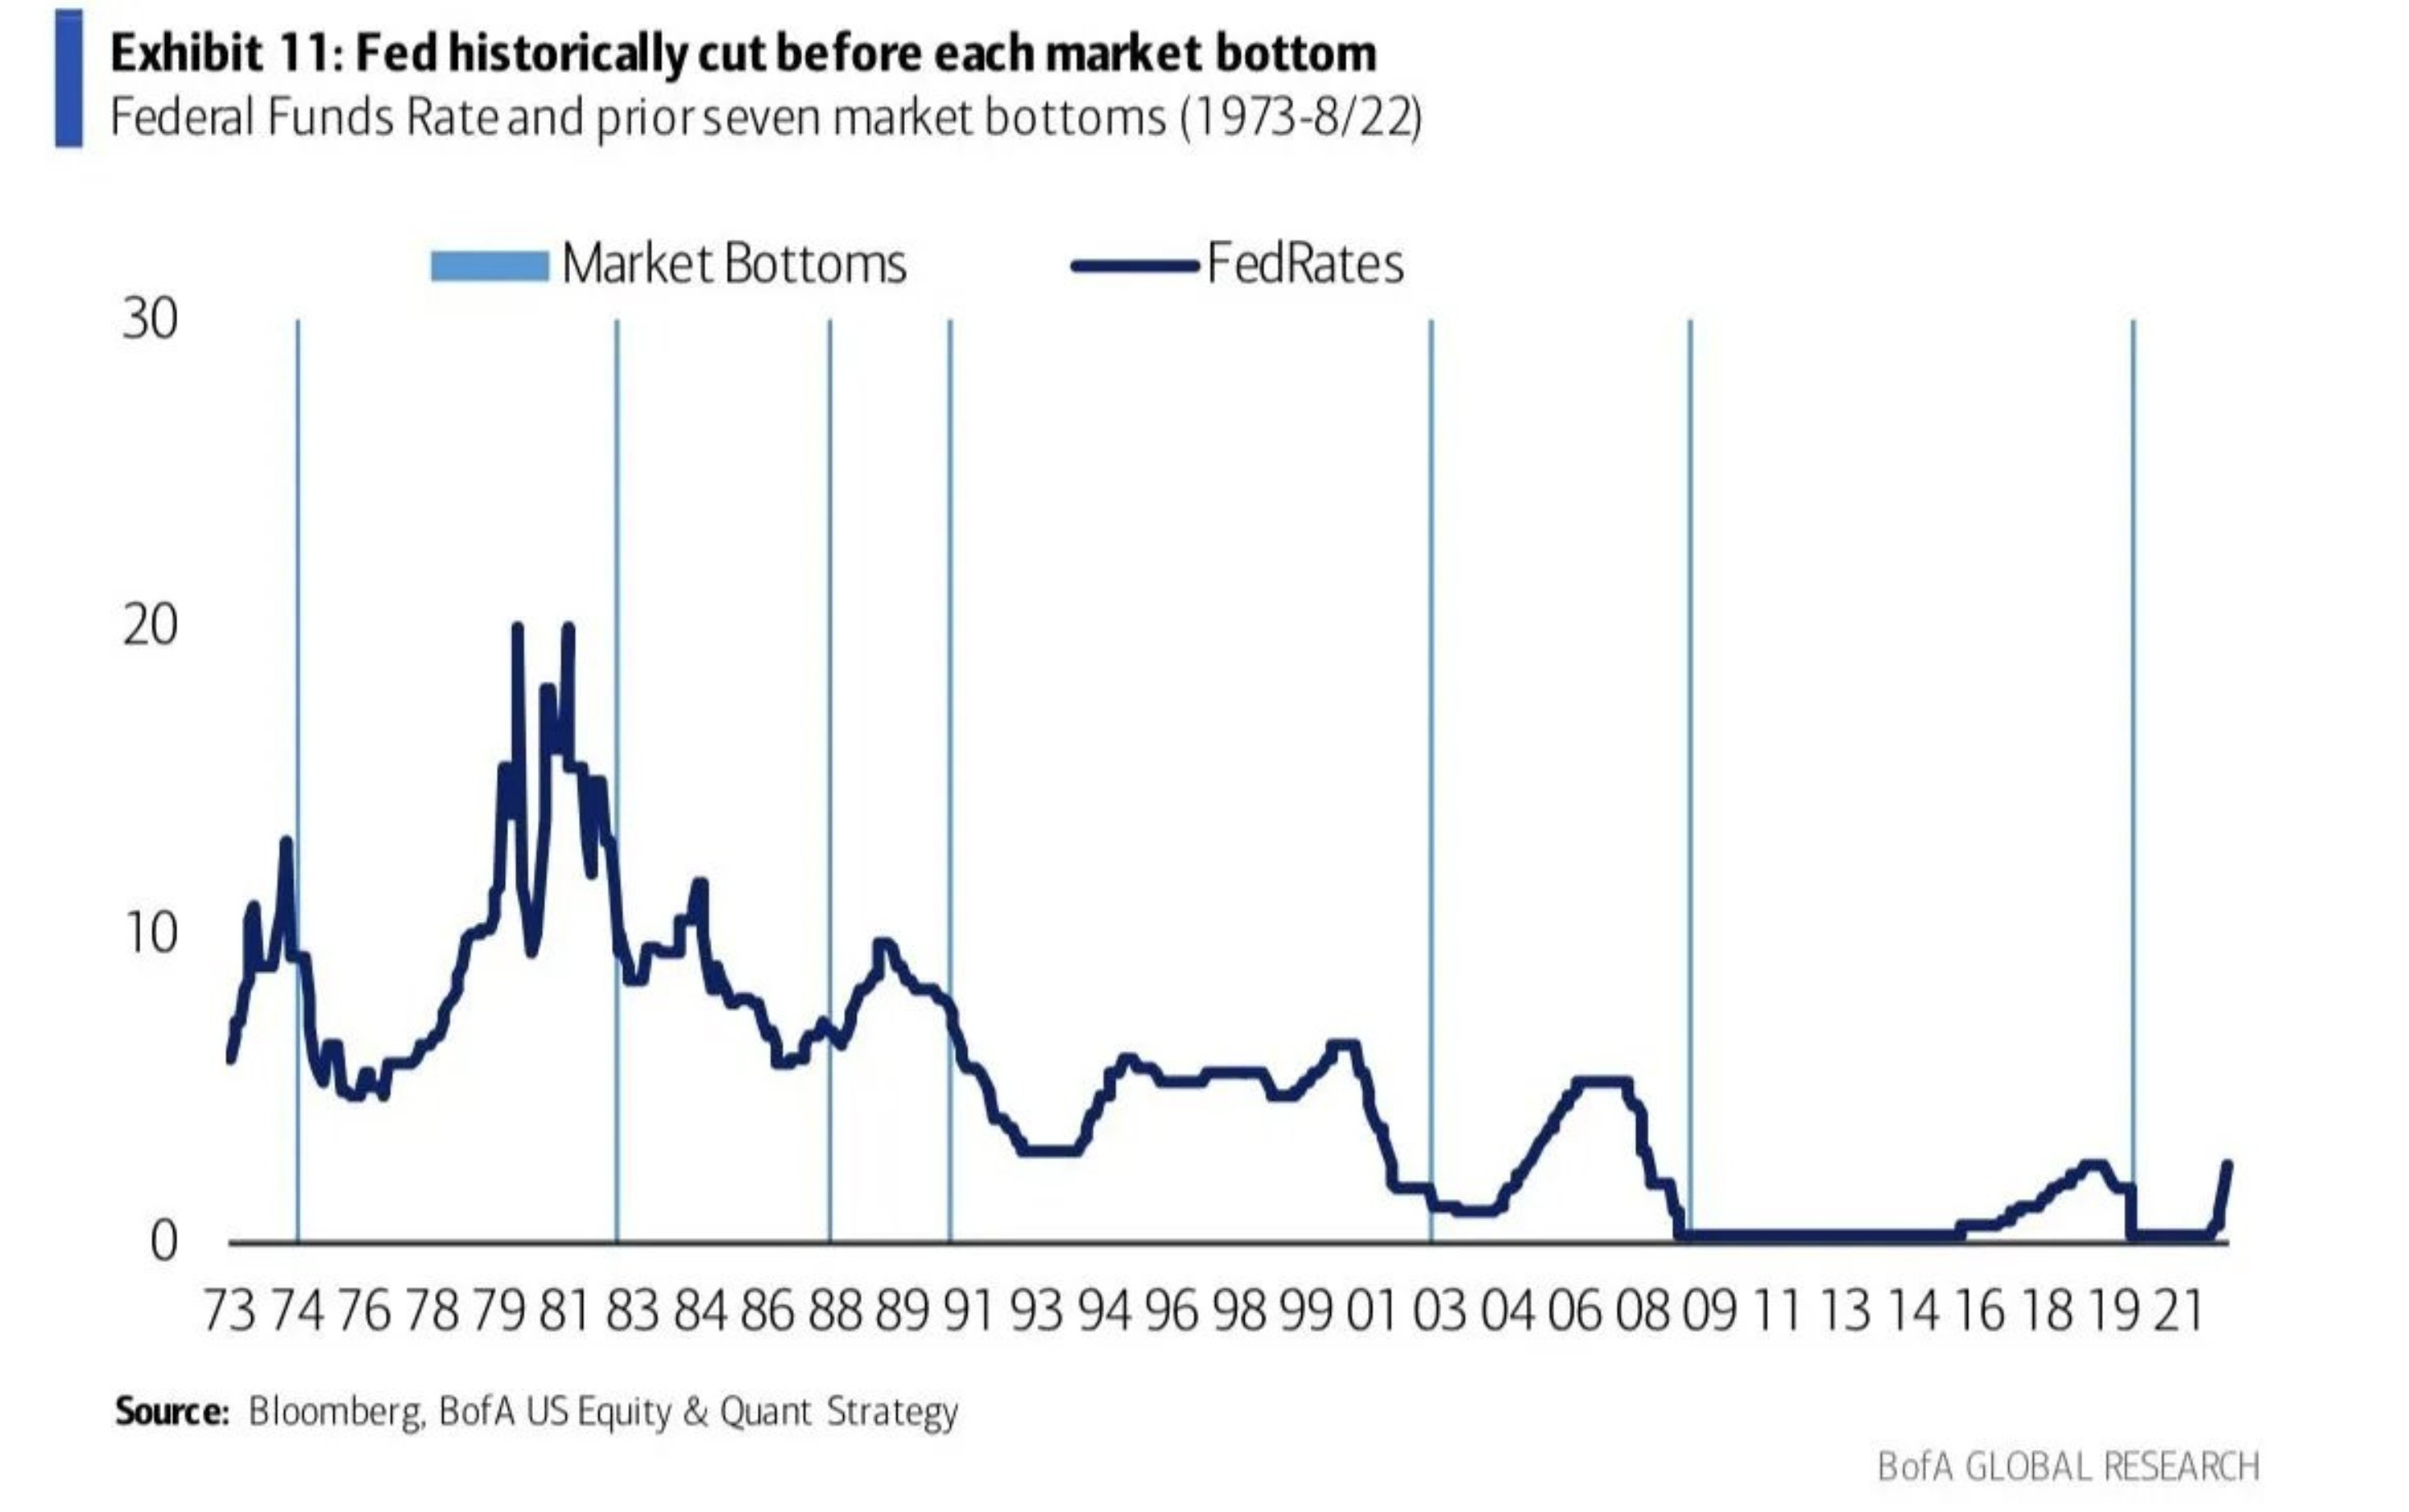
Central banks around the world have been raising interest rates in an effort to combat rising inflation. Canada, US, and Europe all recently bumped rates last week— the consumer price index came in at 7.1%, slightly lower than the expected 7.3%. This was initially seen as bullish news, but the S&P 500 failed to sustain its initial rally and ended the week lower after the Federal Reserve signaled more rate hikes to come. It's worth remembering that the stock market often bottoms after interest rates have peaked, but with more rate hikes signaled for the future, it seems a safe bet that rates have not yet peaked.
The chart below comes from Bank of America Equity & Quant Strategy Note this past summer.
This week's note builds upon the discussion from last week, exploring additional factors that suggest the market may be returning to its downward trend.
S&P 500 Technical Indicators Point to Potential Move Lower
The S&P 500 closed below key moving averages, including the 20-, 50-, and 200-day exponential moving averages (red, blue, and black respectively), and may face resistance at the 3915 - 3875 level which failed to offer support. If bearish technical events, such as a negative crossover on the chart, occur before the end of the year or in early January, it could signal a move lower towards the 3000 - 3400 range. In my current thought, I am inclined to think that the market may bottom out around 3200. However, this is a tentative prediction, and there may be several pauses in the downward trend, such as between 3750 and 3800 or at the October lows of 3500.
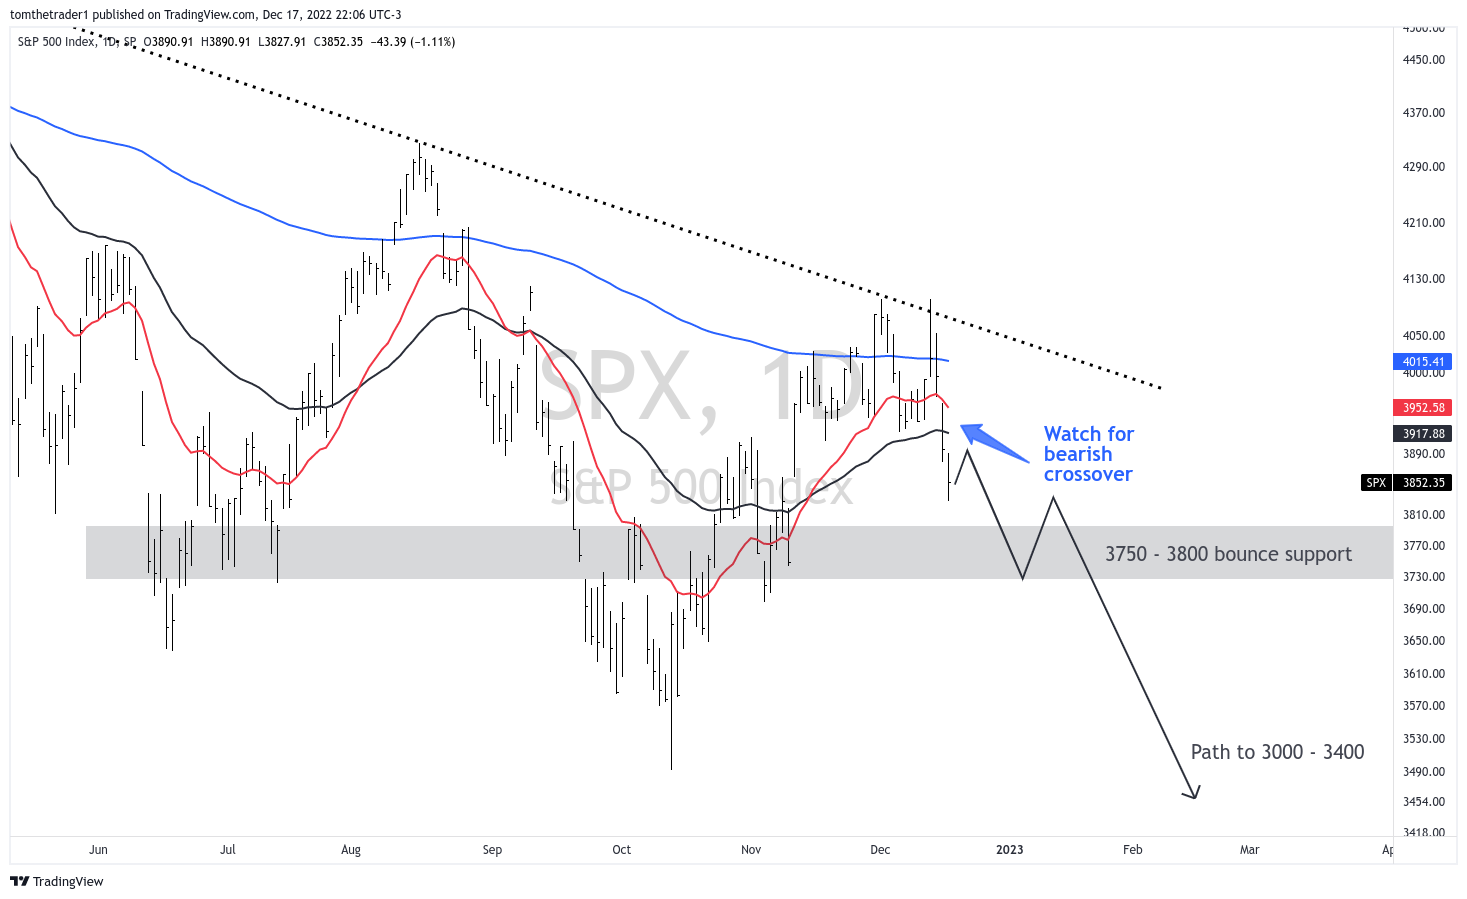
If the market were to break below the October lows, it could accelerate the rate of decline.
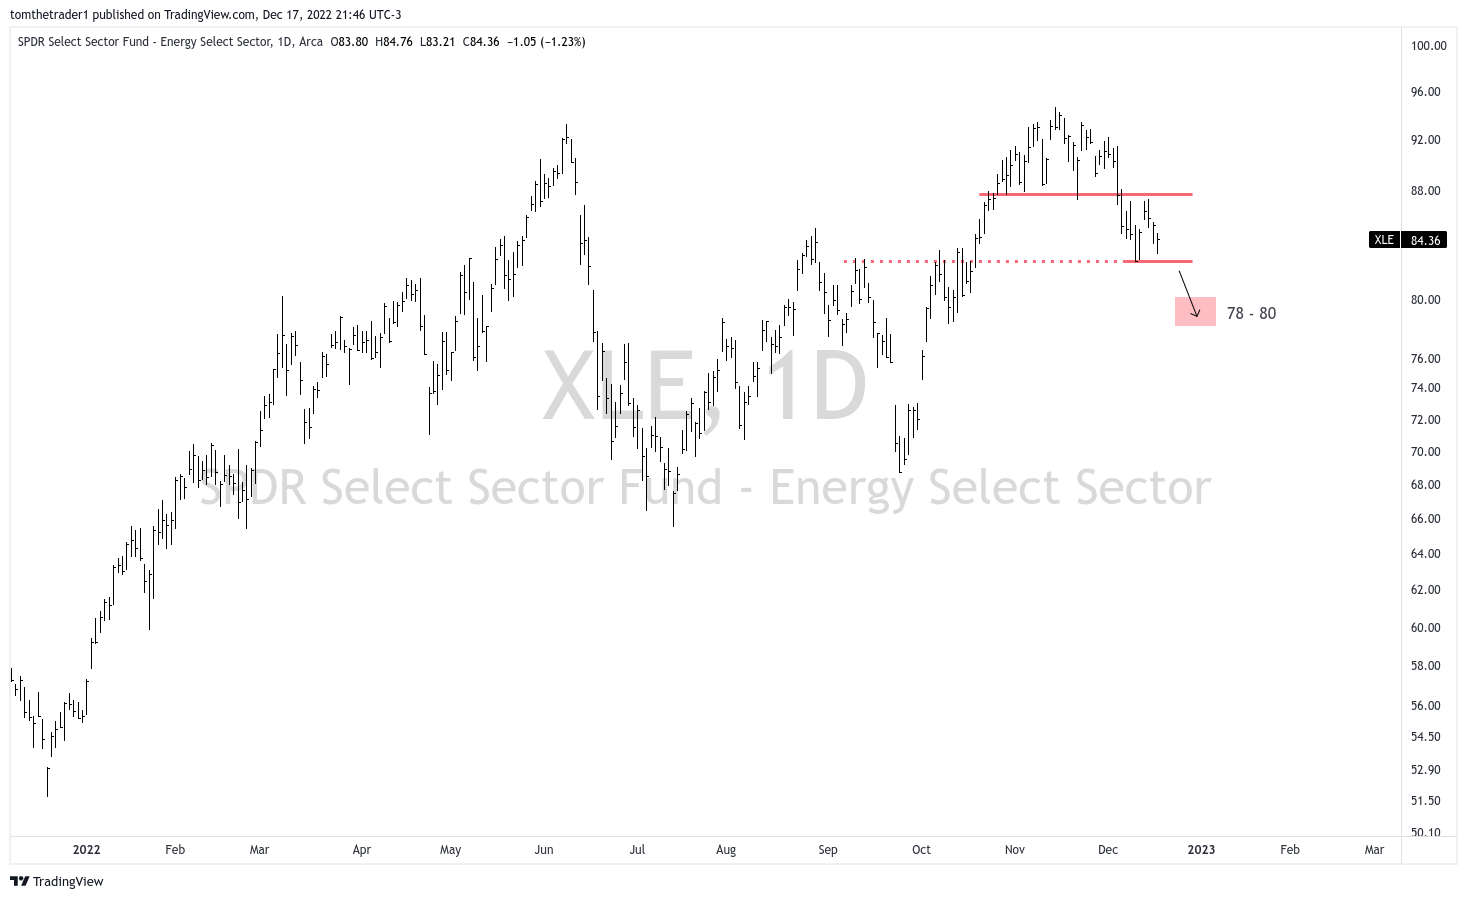
Energy Sector Breakdown on Horizon
The Energy Select Sector SPDR Fund (XLE), is also approaching a critical level. If it breaks below 82, it could indicate another short-term breakdown, with a potential decline to 78.
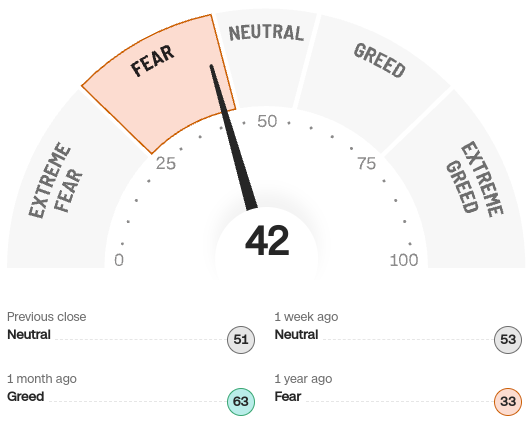
Market Sentiment and Apple—
Overall, market sentiment, as measured by the CNN Fear and Greed Index, has moved into the fear category in just a few weeks, showing the rapid change in price and sentiment.
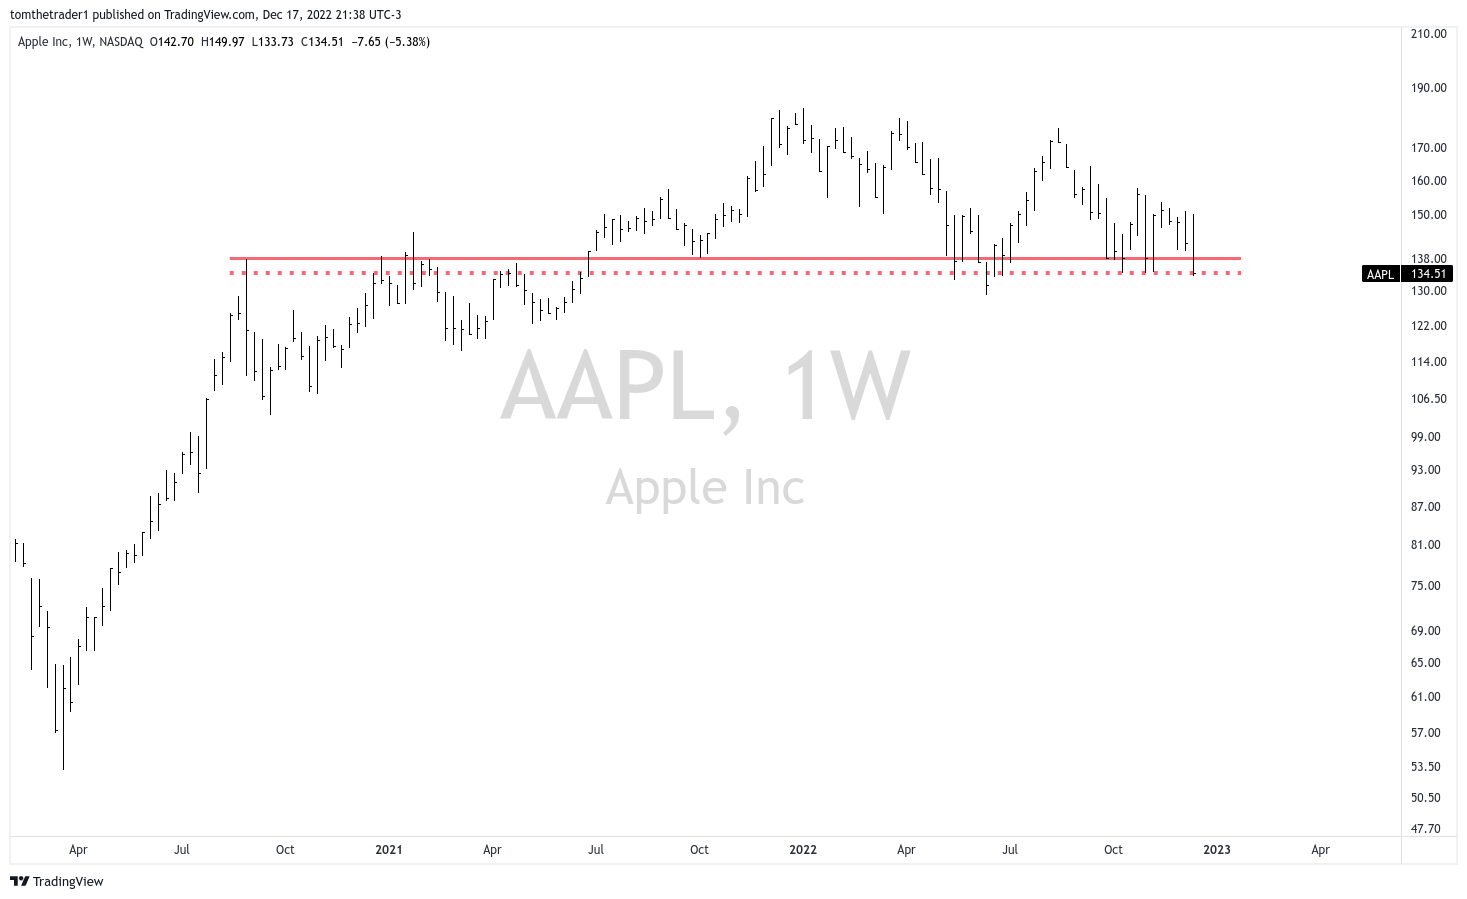
Apple stock, in particular, is worth watching as it approaches the crucial 130 level, a multi-year pivot that could create panic if it is breached.
Key Levels to Watch
In summary, the current market environment is uncertain, with central banks continuing to raise rates and technical indicators pointing to a potential move lower in the S&P 500. Keep an eye on key levels and sectors, including the 3915 - 3875 range on the S&P 500, the 130 level on Apple, and the 82 level on the XLE (Energy ETF).
Timely Newsletter Insights
This newsletter has contained timely insights about the stock market.
On August 31, it was noted that the market resembled the environment and chart of 1969, and warned of a bearish crossover. This happened the following week.
On September 18, the article discussed the technical deterioration in the S&P 500 and predicted that the June lows would be revisited, which occurred the following week.
On September 25, the article continued the comparison to 1969 and identified a potential double bottom as an area to initiate a relief rally. This rally started on October 13 and reached its target area on October 28.
From October 30 to December 3, the articles discussed the end of the relief rally, which is currently being determined. So far, the S&P 500 has extended moderately above the target of 3900-4000 and is now beginning to retrace.
Disclaimer: The information in this article is for informational purposes only and should not be considered financial advice or a recommendation for any investment. I am not a financial advisor, and the content is not intended to serve as financial advice. It is solely intended to ignite thought and discussion.
Tickers mentioned in this newsletter: SPY 0.00%↑ AAPL 0.00%↑ XLE 0.00%↑