Finding the Stock Market Bottom in 2023
Market Outlook for 2023
Seasonality for 2023—
As we kick off the new year, I wanted to share a chart that has been particularly useful for me in thinking about how past bear markets can shape our expectations for the future. I've found myself referencing it frequently over the past year as I've tried to make sense of the market and I thought it would be a good place to start the conversation for this year.
This seasonality chart for the S&P 500 captures the trends during bear markets, using the criteria of the price being below its 200-day moving average and the market finishing the year down. As you can see in the chart below, the red and darker red lines illustrate these two scenarios.
From this chart, we can draw several key insights:
January tends to start with a sharp but short-lived rally
When the S&P 500 is below its 200-day moving average, like it is currently, the depth of declines tends to be worse
The "sell in May and go away" strategy has historically been effective during bear markets as originally written by Topdown Charts
Sustained market advances tend to occur in March and October, each lasting about six weeks— when thinking about 2023 if these seasonal rallies occur they will likely also be good bear market bottom candidates.
The end of the year tends to be flat during bear markets, with no appearance from Santa Claus
State of the S&P 500
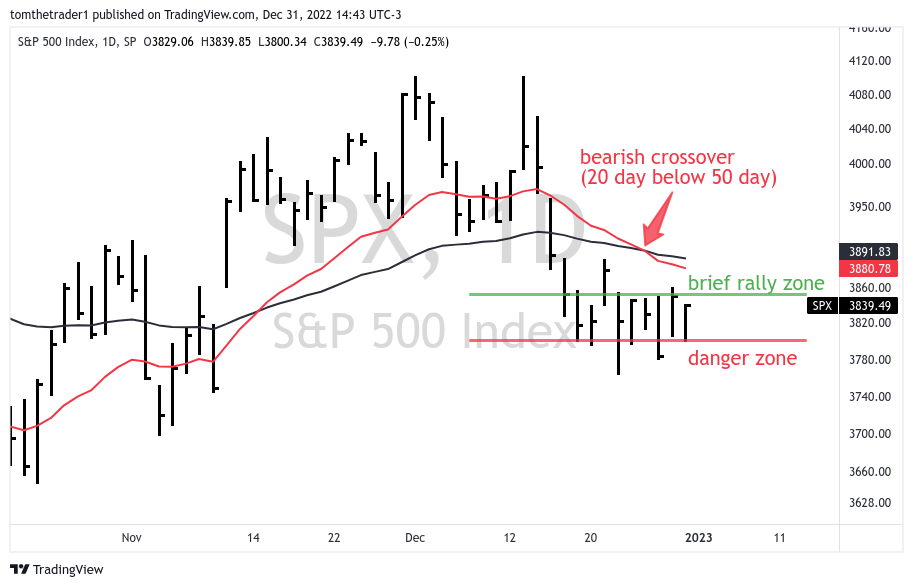
Turning to the current state of the S&P 500— the index declined just over 6% from its December highs to end the year and rests at a support level of 3800. The short duration moving average (20 day) has crossed below the medium duration moving average (50 day), which could signal a potential breakdown ahead. I will be keeping an eye on these moving averages as resistance on the downtrend, as we've seen them act as loose resistance throughout the decline segments in 2022.
Apple’s Multi Year Pivot
Apple stock has ended below 130, a key multi-year pivot point. I believe that on the next decline, we could see Apple trading in the 115 to 120 range, and potentially as low as 100 to 105 at the 2023 low.
The Short Term Thought— What about the seasonal rally in January?
In terms of the seasonal rally in January— “the January effect”, the earlier chart shows it as sharp but short-lived. If the S&P 500 is able to trade above the resistance at 3850, we may see some upward momentum pushing the price towards 3950. However, if the index falls below 3800, I would anticipate further acceleration of the decline back initially towards the October lows and potentially lower.
For me, I’m not interested in trading it or participating.
The Longer Term Thought— Finding bottom in 2023
Looking longer term, recent inflation data suggests that the peak is behind us, however central banks still have work to do to achieve target— they are still raising rates and have signaled further increases ahead.
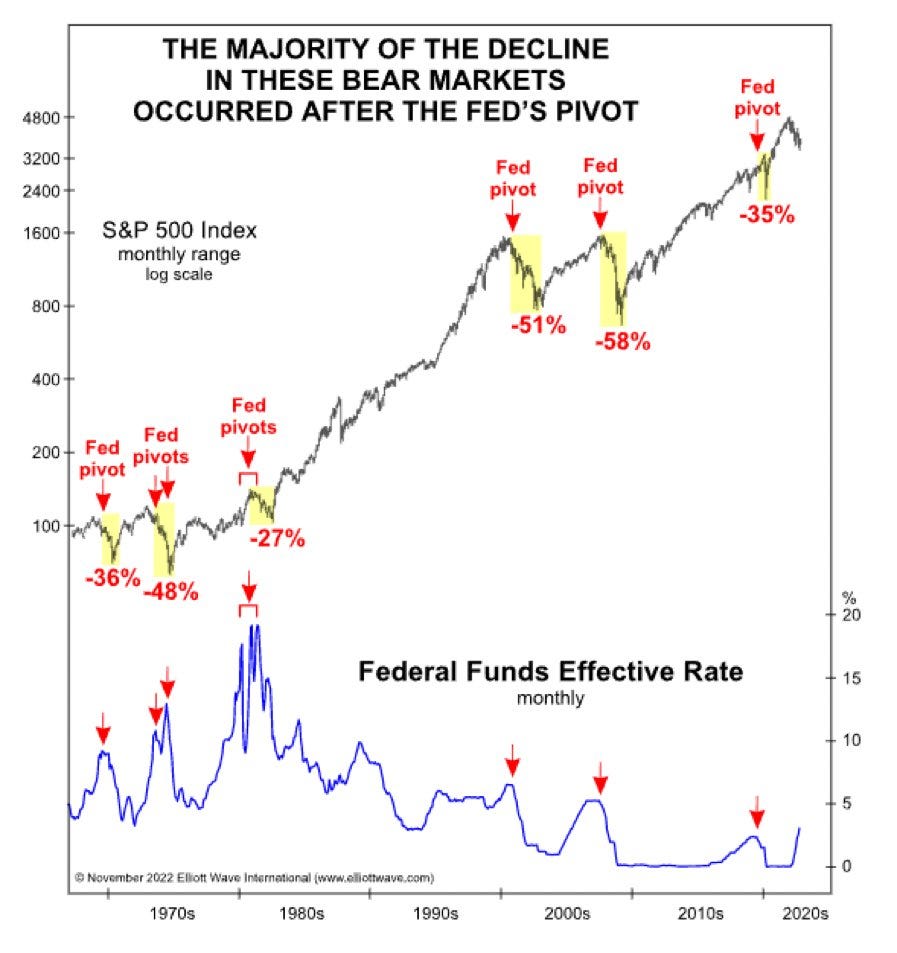
History has shown that the stock market often bottoms after interest rates have peaked— this is best illustrated by an annotated chart of the S&P 500 from EWI. The news of the formal fed pivot will reverberate across financial media— you won’t miss it when it happens. When that happens— I think it will be appropriate to begin strongly considering the formation of a bottom for this market decline.
Market Bottom Levels To Watch
I am considering the possibility that the S&P 500 may bottom out around 3200. This area has strong horizontal support and is also the 0.618 retracement of the pandemic low in March 2020 to the peak in January 2022. If the bear market follows previous patterns, we could see a bottom forming in late March/early April, or potentially October/November if a bottom has not yet been defined by then.
The red candles in the chart below illustrate a decline from January through March bottoming around 3200.
In the event that something else is underway in the markets— the 4220 level on the S&P 500 remains my marker to consider an adjustment to my strategy. This level is flexible and represents a price 5% above the long duration moving average (200-day).
Year End Performance
Overall, the S&P 500 finished the year down 19.9% and the Nasdaq 100 was down 33.6%. My own portfolio performance for the year was -9.4%, thanks in part what I’m referring to as the "portfolio pivot" of moving 45% of my allocation to cash in mid-August and continuing to sell in September and October to become cash dominant and effectively "out of the market." Hindsight is always 20/20, but this move helped to preserve capital and provide clarity in a volatile market.
Thank you for following along throughout 2022, I look forward to providing updates, analysis and insights as the market evolves. Happy New Year.
Tom
Timely Newsletter Insights
This newsletter has contained timely insights about the stock market.
On August 31, it was noted that the market resembled the environment and chart of 1969, and warned of a bearish crossover. This happened the following week.
On September 18, the article discussed the technical deterioration in the S&P 500 and predicted that the June lows would be revisited, which occurred the following week.
On September 25, the article continued the comparison to 1969 and identified a potential double bottom as an area to initiate a relief rally. This rally started on October 13 and reached its target area on October 28.
From October 30 to December 3, the articles discussed the end of the relief rally, which concluded on December 13. *At the peak of the rally the S&P 500 had extended moderately above the target of 3900-4000
Disclaimer: The information in this article is for informational purposes only and should not be considered financial advice or a recommendation for any investment. I am not a financial advisor, and the content is not intended to serve as financial advice. It is solely intended to ignite thought and discussion.
Tickers mentioned in this article: SPY 0.00%↑ QQQ 0.00%↑ AAPL 0.00%↑


