


Exploring the Bear Market: Key Pivot Points and Potential Market Bottoms
Technical Analysis and Short Ideas

Reflecting on the Bear Market
I found myself thinking about when the stock market will eventually bottom out. This week's newsletter will explore my thoughts on where this may happen.
The longest bear market in history lasted for 2.5 years. The shortest lasted for just under a month. Since 1928, the S&P 500 has experienced 21 bear markets, with an average of one every 4.5 years. On average, a bear market lasts for 1.1 years. The current bear market, which began on January 4, 2022, is almost a year old, which is roughly the average length of a bear market.
The chart below shows the S&P 500 was rejected at the descending resistance trend line for the third time this year, halting the rally around the golden pocket (yellow lines). One final technical event remains before I can confidently say that the recent rally was just a bear market rally. This event is a bearish crossover between the short and medium duration moving averages. In my analysis, the short duration represents 20 days, and the medium duration represents 50 days. Prior crossovers are highlighted with a blue circle.
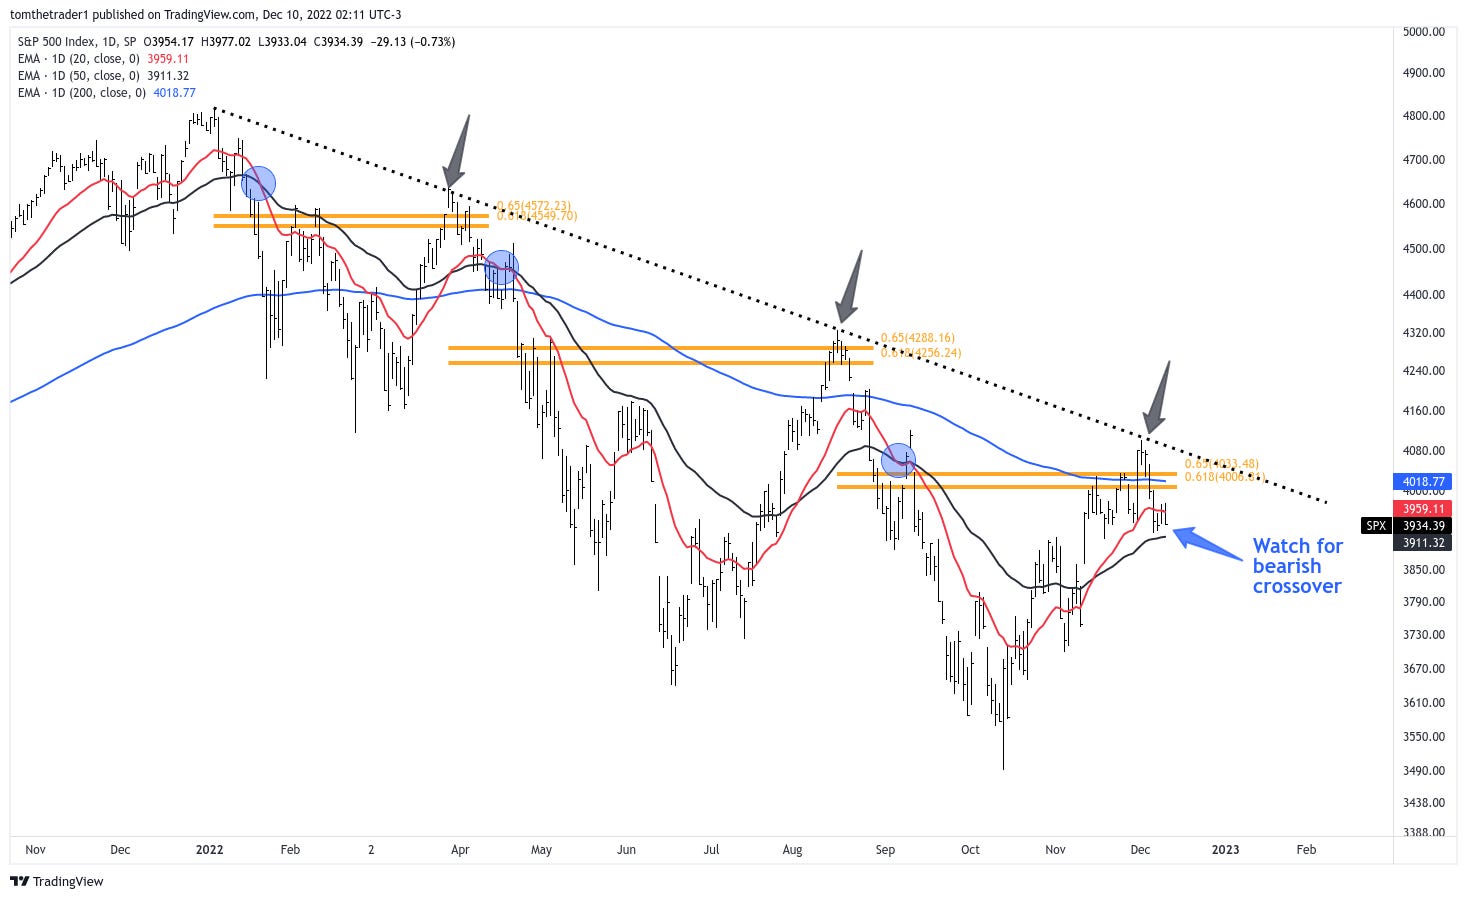
Tug of War at Key Pivot Point
The past week has brought the S&P 500 price back into the "tug of war" area between 3875 and 3915. This area has consistently been a pivot point for market indecision throughout the latter half of this year, and I expect the same to hold true on this visit. The more important question is whether the S&P 500 will trade below 3875. If this occurs, it is likely that the relative high in November is in and the larger market decline is continuing.
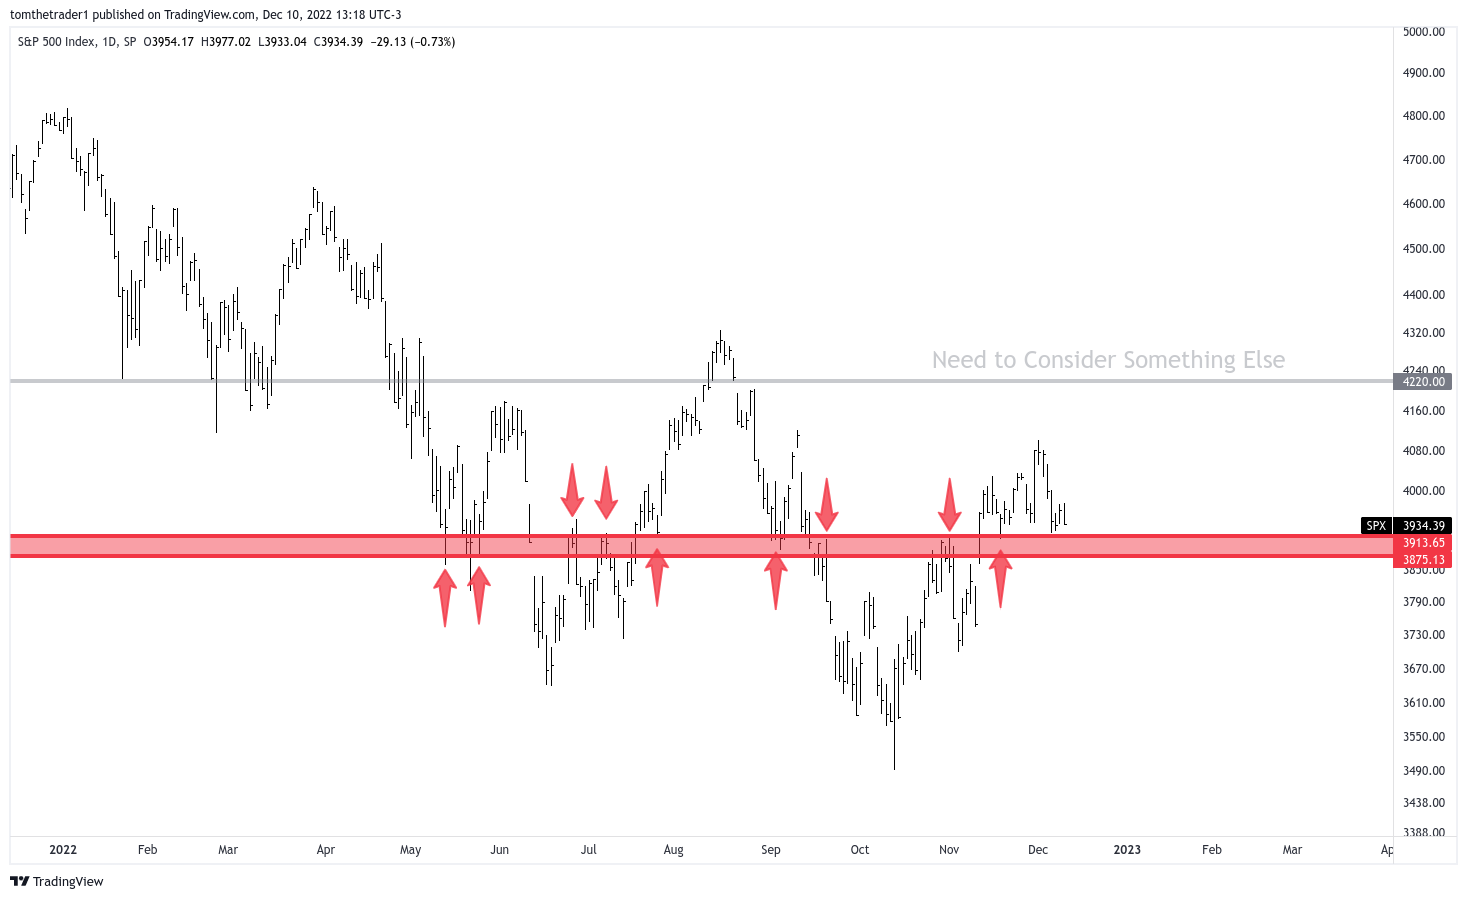
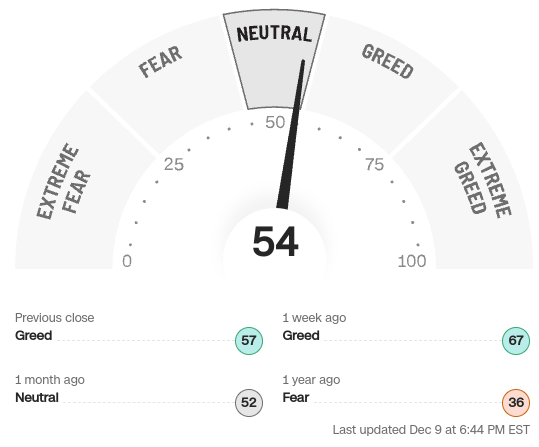
According to the CNN Fear and Greed Index, the market sentiment is currently neutral heading into this tug of war zone. This is a significant change from the greed state that the market has been in for the past month. In my view, this suggests that the 3875 - 3915 area is likely to be the focal point for the next three to six months.
In the opposite scenario the key point to watch is 4220. If the S&P 500 can reach this level, it could indicate the start of a sustained reversal. However, until it closes at or above 4220, this advance remains a bear market rally in my analysis. This level of horizontal resistance is represented by the grey line and text in my chart above.
Paying Attention To Apple
After reviewing the charts for Apple, Amazon, Google, and Tesla, I have found that the risk to reward ratio is poor. I do not see anything particularly positive in their current state. I think 130 on Apple might be the most important level for everyone to pay attention to.
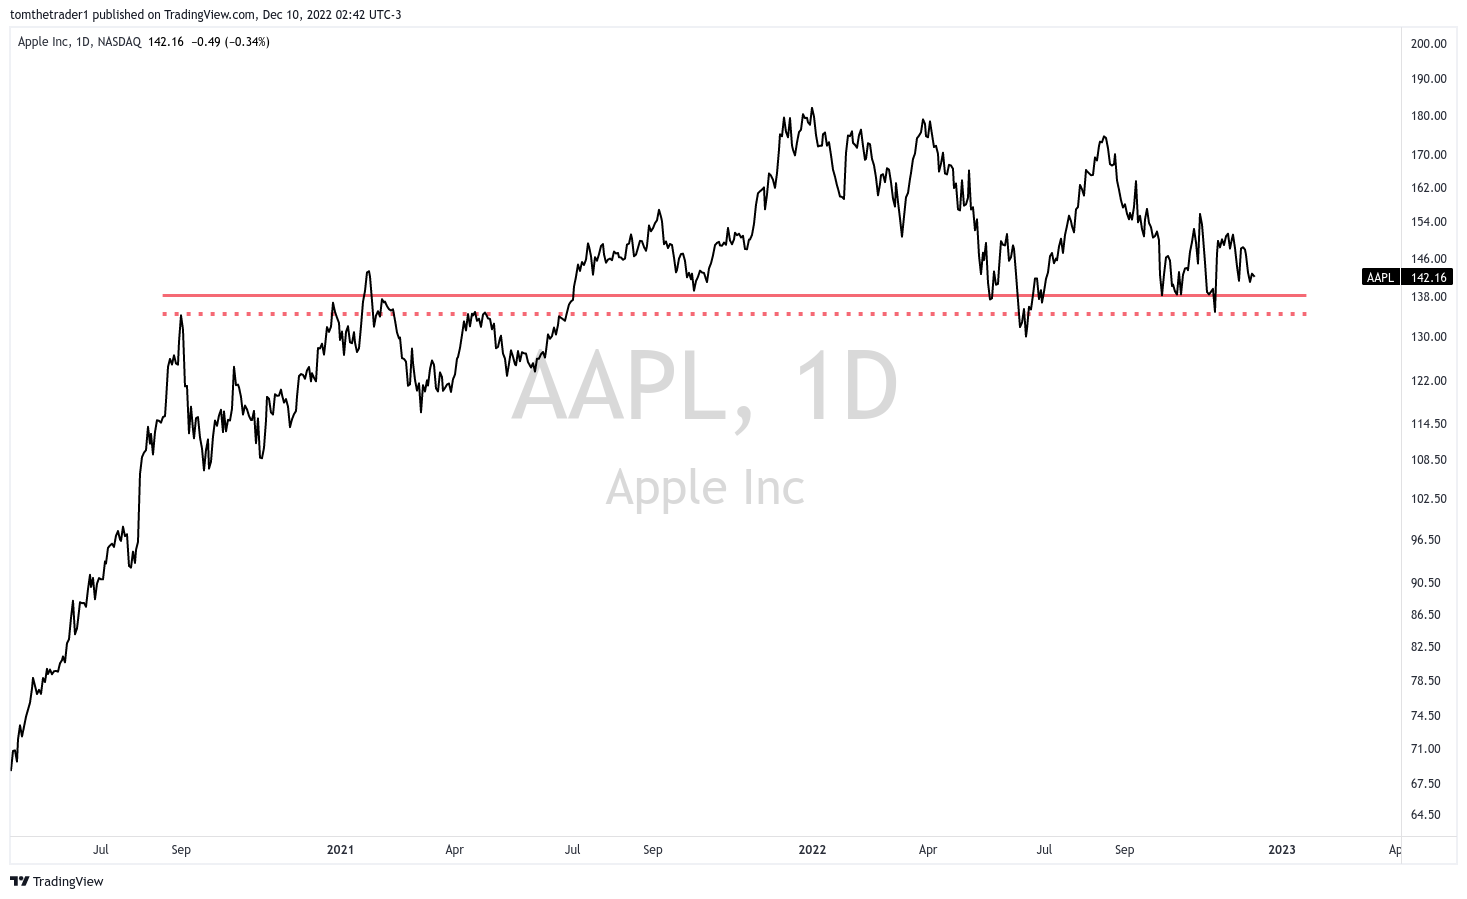
The 130 area on Apple's stock has acted as both resistance and support since September 2020, a period of over 2 years. For my analysis this indicates that market participants have consistently been active in this price range. If the stock falls below 130, I consider the initial risk to be around 115, a drop of 12%— I think that could drag the entire S&P 500 with it.
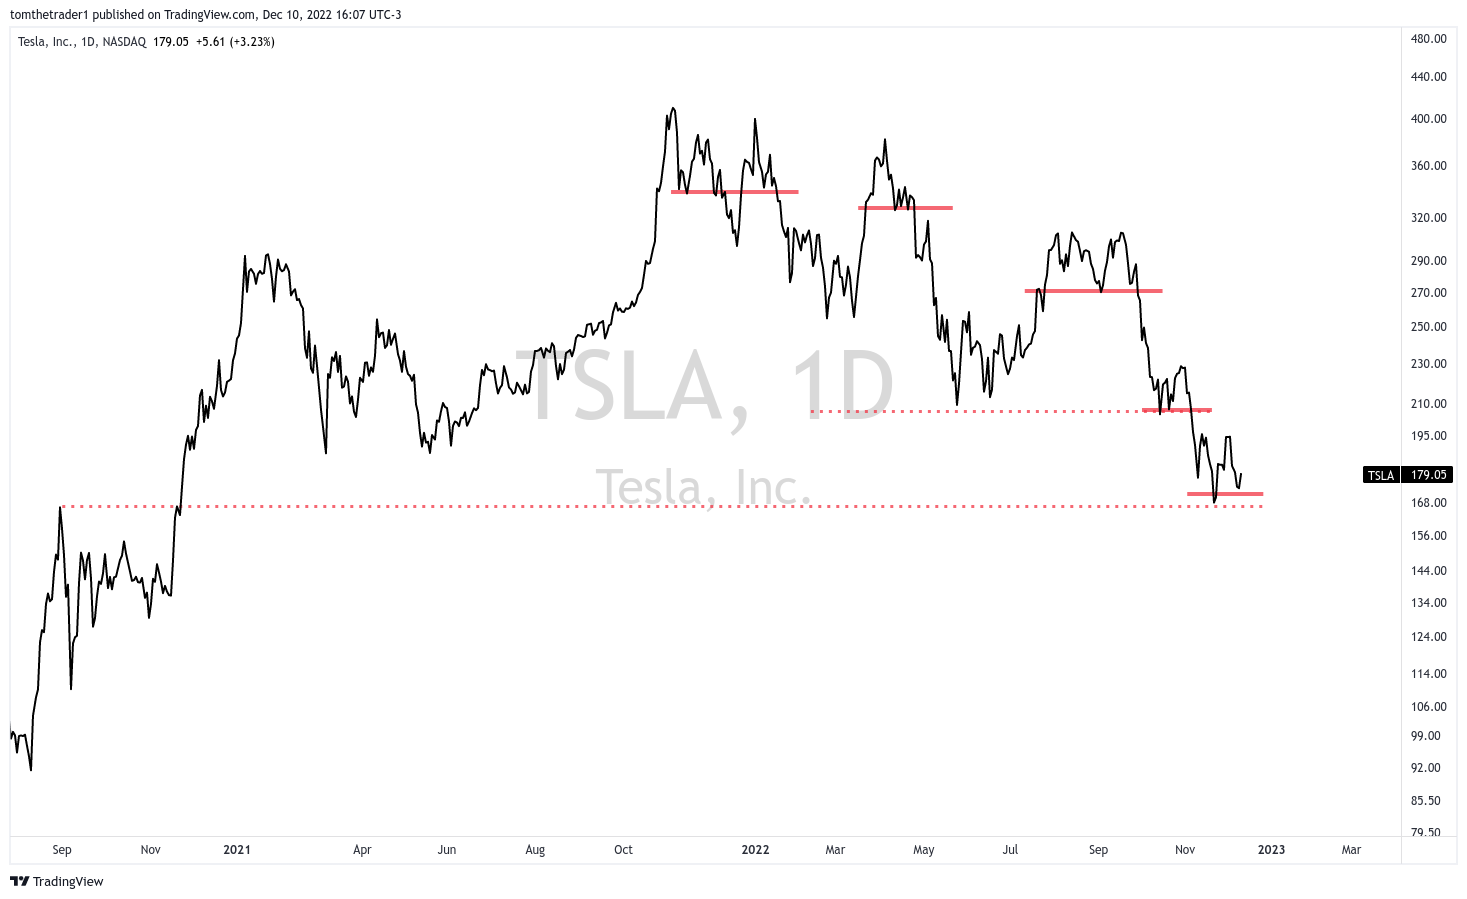
Tesla's stock has been a tale of building support and breaking down. A drop below 170 could create headwinds for the S&P 500 and Nasdaq indices.
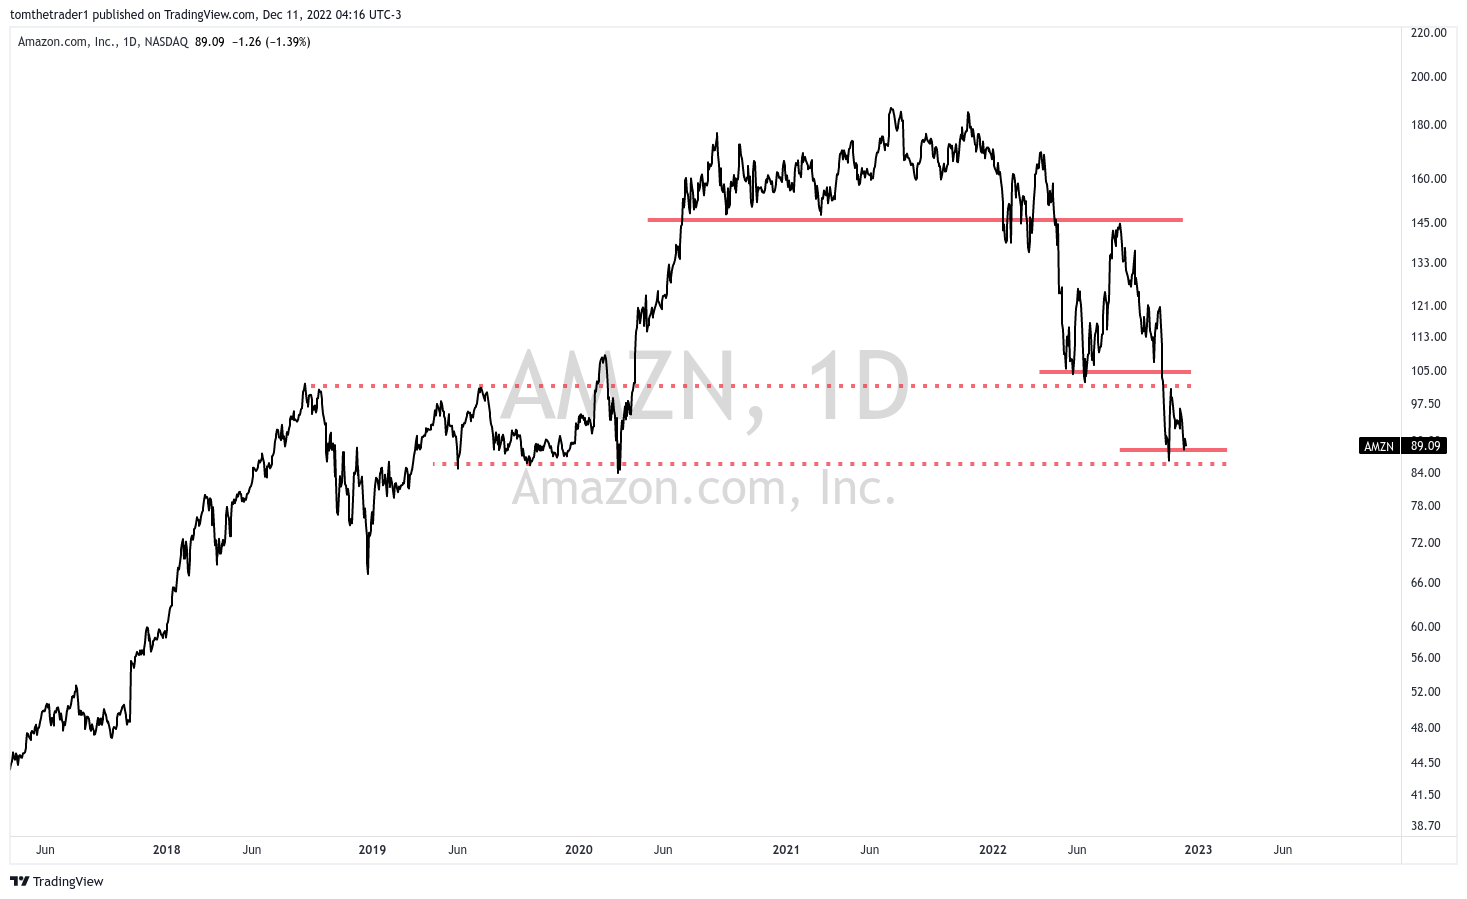
Amazon's stock chart resembles Tesla's, with building support followed by breakdowns. If the price falls below 85, the next target is 75.
If Apple, Amazon, and Tesla continue to decline, I think it is then likely that they will drag the rest of the market down with them. The charts of Google and Microsoft do not look much better.
Potential Market Bottoms: 3200, 3400 or 3000?
In my opinion, the stock market bottom is likely to occur between 3200 and 3400, with a higher probability of it happening at 3200. This area has significant horizontal support and also holds technical significance as the 0.618 retracement of the pandemic March 2020 bottom to the January 2022 peak, where this bear market began.
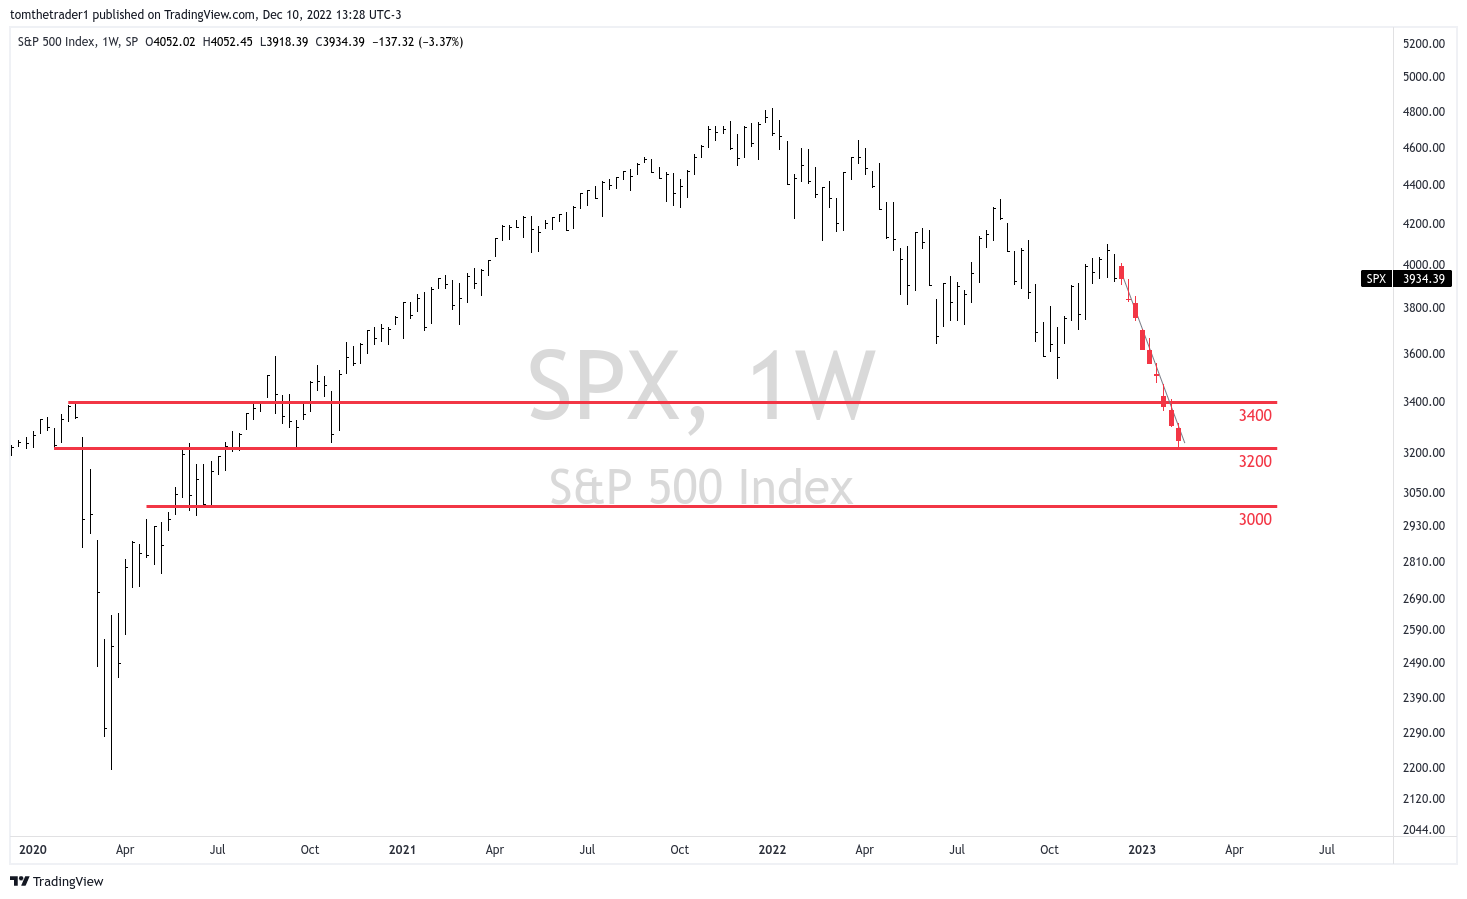
The 3000 area on the S&P 500 also has a psychological “whole number” significance, making it a potential location for the market bottom to occur. Over the next 3 to 6 months, it will become clearer which of the three potential bottom candidates is the most likely.
My Market Exposure at Decade Low, Focusing on Short Ideas
My market exposure has reached a decade low, I consider myself out of the market and have been in capital preservation mode when I began scaling out in the middle of August. Currently I do not see any immediate reason to begin scaling into long positions. I anticipate that thought will change as the S&P 500 declines towards 3200. What I do see are a few short ideas.
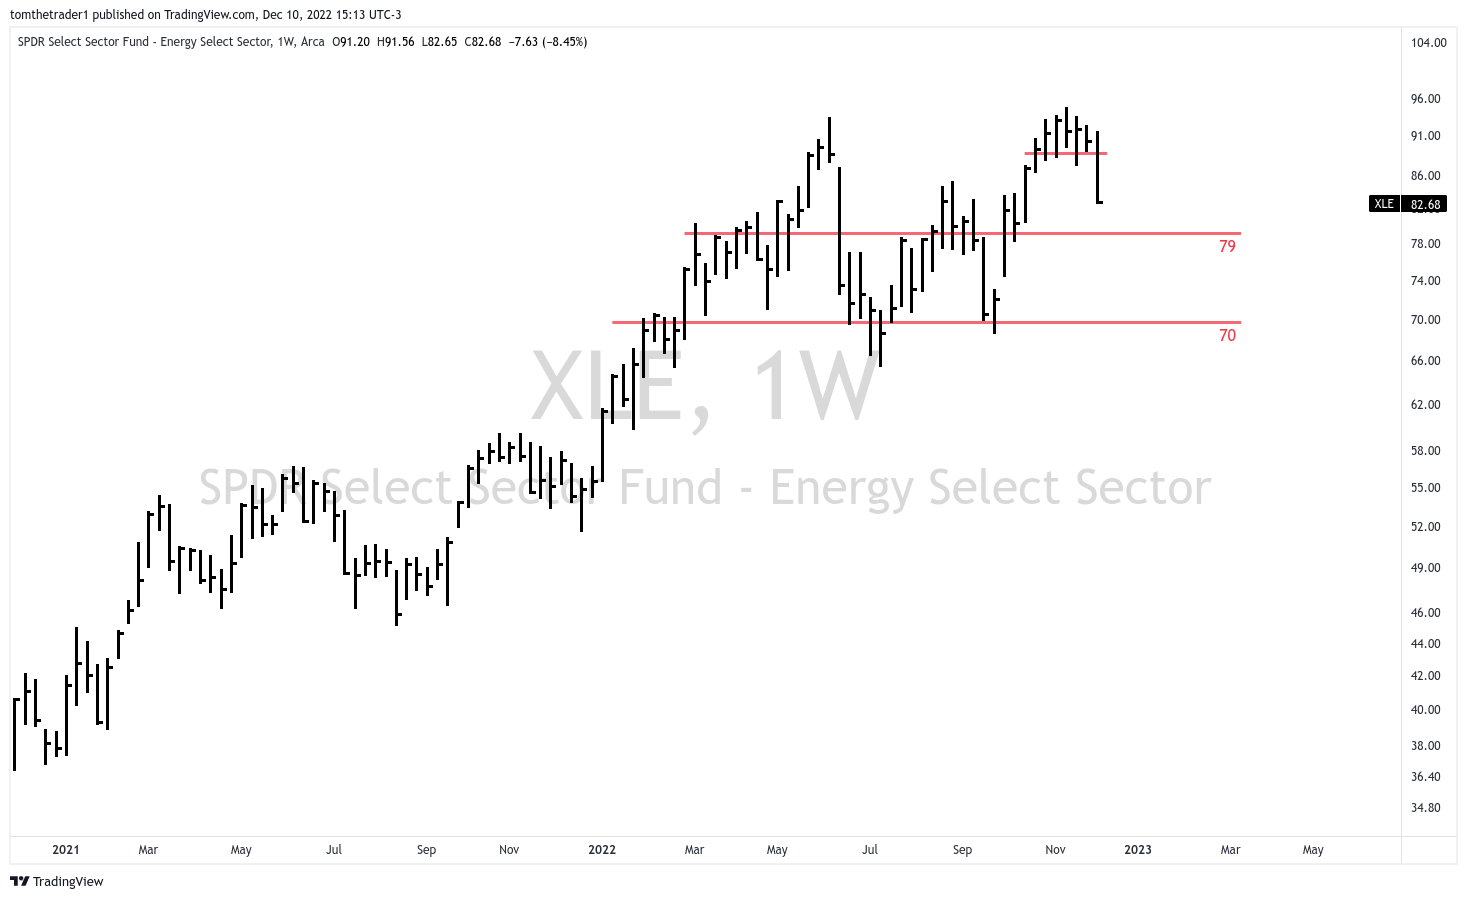
I think the energy segment is about to enter the anxiety stage of its decline. I have positioned myself to take advantage of this by using DRIP (Direxion Daily S&P Oil & Gas Exp. & Prod. Bear 2X). I use XLE (Energy Select Sector SPDR Fund) as a barometer for the energy sector. I consider it likely that the price will decline towards 79, and potentially even lower to 70.
I previously wrote that the Dow Jones leading the rally does not align well with rallies that ended bear markets. I suspect that investors and funds are temporarily hiding in this index. For my idea it is time to short the Dow via SDOW (UltraPro Short Dow30).
Last is the tech giants, they all look to take another leg lower. Apple moving closer towards 130 I consider risky, the whole of Nasdaq I think will feel it. Short tech via SQQQ (UltraPro Short QQQ)
Timely Newsletter Insights
This newsletter has contained timely insights about the stock market.
On August 31, it was noted that the market resembled the environment and chart of 1969, and warned of a bearish crossover. This happened the following week.
On September 18, the article discussed the technical deterioration in the S&P 500 and predicted that the June lows would be revisited, which occurred the following week.
On September 25, the article continued the comparison to 1969 and identified a potential double bottom as an area to initiate a relief rally. This rally started on October 13 and reached its target area on October 28.
From October 30 to December 3, the articles discussed the end of the relief rally, which is currently being determined. So far, the S&P 500 has extended moderately above the target of 3900-4000 and is now beginning to retrace.
Disclaimer: The information in this article is for informational purposes only and should not be considered financial advice or a recommendation for any investment. I am not a financial advisor, and the content is not intended to serve as financial advice. It is solely intended to ignite thought and discussion.
Tickers mentioned in this newsletter: SPY 0.00%↑ DIA 0.00%↑ QQQ 0.00%↑ XLE 0.00%↑ AAPL 0.00%↑ TSLA 0.00%↑ GOOG 0.00%↑ AMZN 0.00%↑