The start of the year has been a strong one for the stock market, with the S&P 500 and Nasdaq both seeing substantial advances. While these figures are impressive in themselves, there have been even more fascinating developments among individual stocks, such as Tesla's impressive 50% increase. Nothing changes sentiment like price.
The positive market trends have not gone unnoticed by active fund managers, who have been drawn back into the market. The NAAIM Exposure Index, which reflects the average exposure of active managers to US equities, offers valuable insights into the adjustments made to client accounts in recent weeks.

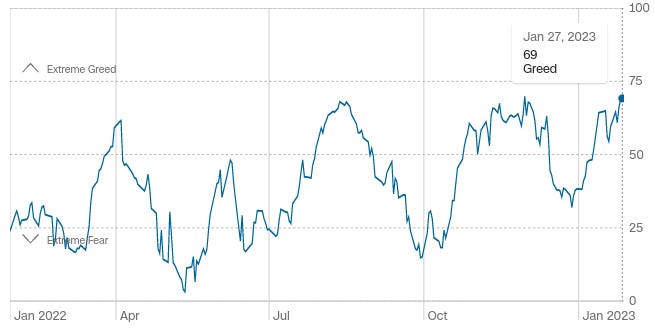
The CNN Fear and Greed Index ended the week at its highest level in the past year, indicating a market guided by greed.

As market participants seem to be all looking in the same direction, it has me feeling cautious about the rising narrative of a "new bull market." Recent history has shown us that similar positioning and sentiment conditions in the past, such as those seen in January, April, August, and December of last year, were swiftly followed by market declines. The recent market advance has all the hallmarks of fear of missing out, with investors succumbing to greed and jumping into the market without taking a step back to consider the bigger picture.
The Bigger Picture—
The S&P 500 chart displayed below is annotated with arrows for added context. The red arrows signify the moments when the CNN Fear & Greed Index reached a high level, signaling an abundance of greed among market participants. The blue arrows, show the points at which the NAAIM Exposure Index peaked, indicating instances when active fund managers positioned their clients as bullish.
Is it different this time?— the answer to that will become clear in the coming weeks.
Market participants will be closely monitoring the earnings reports of tech giants Apple, Amazon, and Google next week, as well as messaging from the Federal Reserve regarding future interest rate hikes, which have become significant market-moving events.
Recap: Similarities Between the Current Market and the Dot-Com Crash
Last week's newsletter highlighted the similarities between the current market position and the dot-com crash of 2000-2003. Specifically, noting that the crash was characterized by two consecutive false breakouts, as identified by the short-term moving average (20 day) crossing above the medium (50 day) on the S&P 500. Despite initial indications of recovery, the market ultimately saw a significant decline of 30%. It's important to keep in mind that while the causes of the 2000 market crash differ from the current bear market, the current market position shows striking resemblance to the past.
Michael Burry's Market Insight: A Cautionary Tweet?
Last week, notable investor and hedge fund manager Michael Burry, famously portrayed in the film "The Big Short," shared his thoughts in a tweet— he circled the same area in 2002 where the market saw back to back false breakouts tweeting "Maybe.”
I agree— Maybe.
While my current outlook for the S&P 500 is bearish, I keep in mind a level at which I must reconsider my perspective. As Martin Zweig said, "It's okay to be wrong; it's unforgivable to stay wrong." That level for me is 4220. My analysis of past bear market declines has shown that once the S&P 500 successfully advances 5% above its long-duration moving average, it's more likely that a bear market bottom is in place and a genuine reversal is in progress. At that point, I will re-evaluate my bearish outlook and adjust my strategy accordingly.
As highlighted at the start of this newsletter, Tesla has seen a remarkable 50% year-to-date advance. However, zooming out, it appears to be a retest of the 175-200 level at which the stock experienced an accelerated breakdown.
Timely Newsletter Insights
This newsletter has contained timely insights about the stock market.
On August 31, it was noted that the market resembled the environment and chart of 1969, and warned of a bearish crossover. This happened the following week.
On September 18, the article discussed the technical deterioration in the S&P 500 and predicted that the June lows would be revisited, which occurred the following week.
On September 25, the article continued the comparison to 1969 and identified a potential double bottom as an area to initiate a relief rally. This rally started on October 13 and reached its target area on October 28.
From October 30, 2022 through January 2023, the articles discussed the end of the relief rally. *At the peak of the rally the S&P 500 had extended moderately above the target of 3900-4000. The market has remained in this area through January 2023. Accuracy of this call remains to be determined.
Disclaimer: The information in this article is for informational purposes only and should not be considered financial advice or a recommendation for any investment. I am not a financial advisor, and the content is not intended to serve as financial advice. It is solely intended to ignite thought and discussion.
Tickers mentioned in this article: SPY 0.00%↑ QQQ 0.00%↑ TSLA 0.00%↑


