Analyzing The Noise— Let me explain.
The Federal Reserve is likely to continue raising interest rates, and I consider the longer term rate forecasts with a grain of salt (ie. no rate cuts in 2024), the short term guidance is of more importance. The most bullish outcome in the near term is a hike less than 75 bps. While the rate would be going up— it would be going up ‘slower’ and an extended interpretation leads to the eventual pause and pivot.
The Fed is already starting to point in that direction. This minor narrative switch sounds good enough to deliver a relief rally before markets resume the greater decline.
Pivots & Market Bottoms—
My study suggests that the market will bottom after the Fed makes a pivot reversing the course on interest rates. The chart below shows the S&P 500 and the Effective Federal Funds Rate.
History shows the S&P 500 has bottomed more often months after interest rates peak. Red lines represent peaks in the fund rate where the S&P 500 bottom occurred after a pivot.
The Charts—
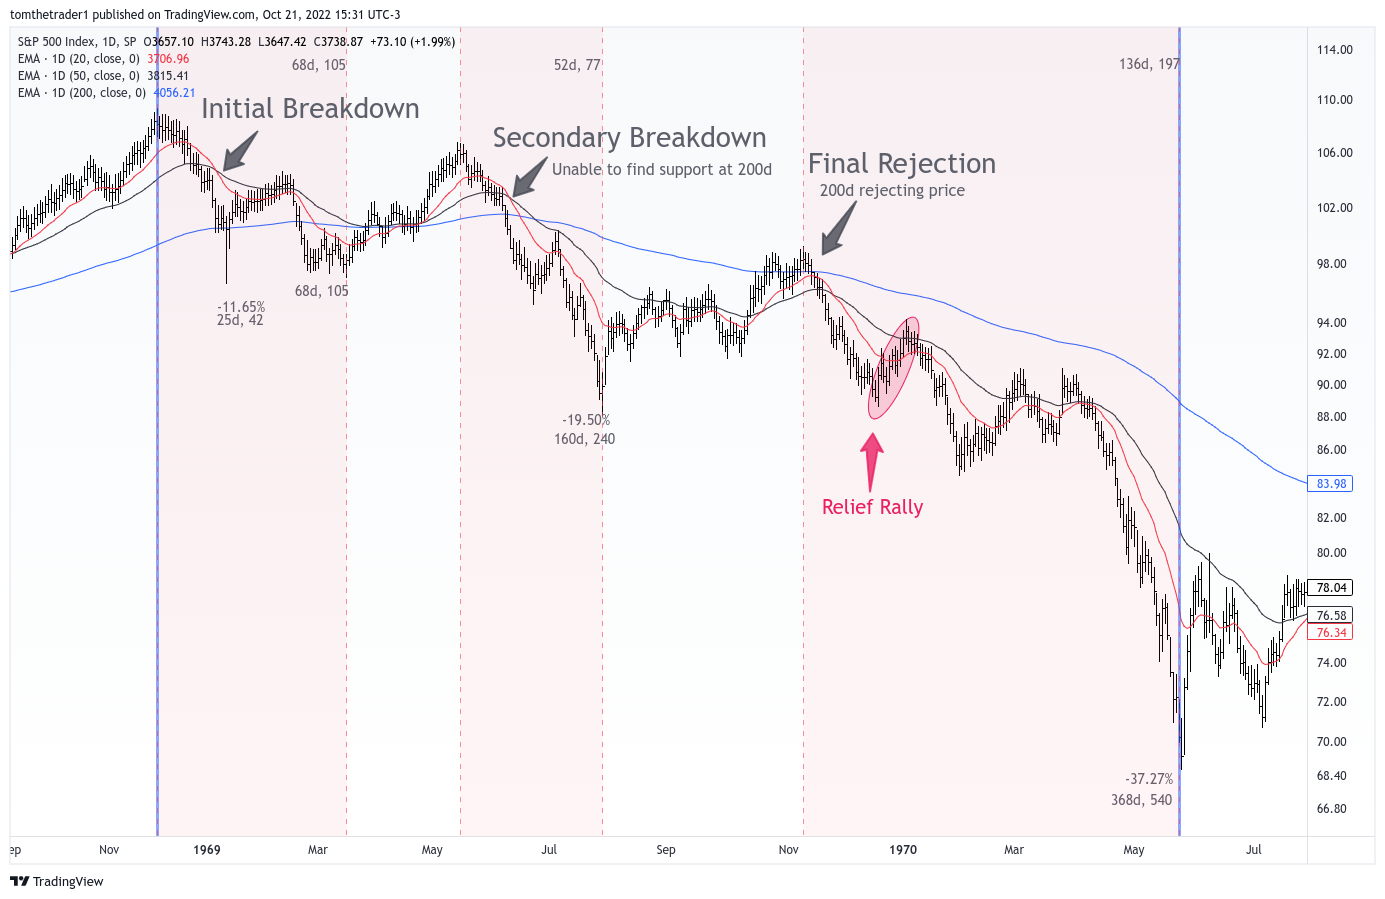
The analog to 1969 remains a primary point of interest in my analysis. The environment of inflation and rising interest rates feels much like the current day headlines, and perhaps of more importance is that the human emotion associated with buying and selling is repeating itself— the S&P 500 chart shows a meaningful correlation.
Between December 02 1968 and May 26 1970 the market declined 37%. I describe the bear market as progressing through three stages: (1) the initial breakdown (2) the secondary breakdown and (3) the final rejection. The breakdowns are defined by the short term moving average crossing below the medium moving average. The red line (20d) crossing below the black (50d). The final rejection incorporates a visual rejection at the long duration moving average. The blue line (200d).
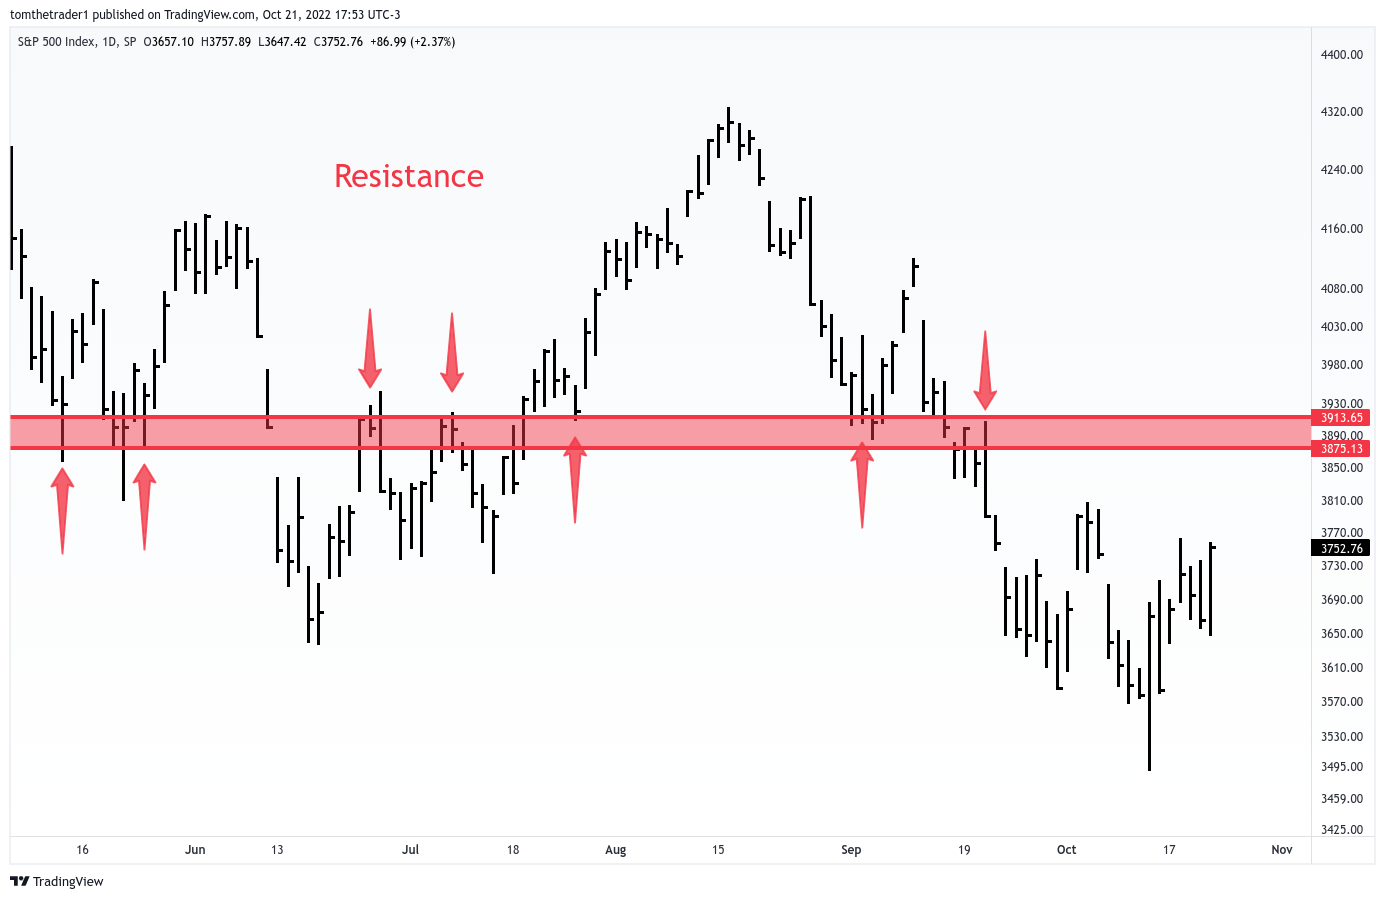
Now a look at the current day market decline.
Readers know this structure is remarkably similar. Under this analog the current S&P 500 is at the stage of a potential relief rally in the context of a much larger decline. There is an abundance of overhead resistance around 3900— this is where I anticipate the relief rally will take pause and resume the downtrend.
The Next 3 - 6 Months
Combining the near term certainty risk of continued interest rate increases with the similarities to how the market behaved in the 1969 analog I maintain a bearish outlook for the next 3 to 6 months, perhaps longer. I remain in a cash dominant position and I have an interest in trading bear market rallies if I can capture a technical edge. Long trades will be on a short leash for the foreseeable future.
Thanks for reading— I appreciate you making Lines On A Chart a piece of your market reading. If you enjoyed this piece— please consider sharing & subscribing.
Anything Else Interesting?
Yes— I have started a trade operation on Coinbase. Simply detailed in a tweet last week.


Long trades are on a short leash— for Coinbase this means a stop loss at 59.
Tickers mentioned in this article: SPY 0.00%↑ COIN 0.00%↑
“The Market” = SPY 0.00%↑ DIA 0.00%↑ QQQ 0.00%↑
Disclaimer: I am not a financial advisor— this article is not financial advice or a recommendation for any investment— The content is for informational purposes only and to ignite the brain neurons.


