
7/5 July Markets
The Consolidating Roller Coaster


July Set Up From June’s Consolidation
The S&P 500 hit an all time high at the beginning of June and thereafter progressed through into a consolidation (easier to see now in hindsight), the consolidation at times created caution, but this weekly note and my core risk management analysis never triggered an alarm, the system kept the portfolio long. One could look back at the index and say that the consolidation range has been in progress for a month longer— since the beginning of May.
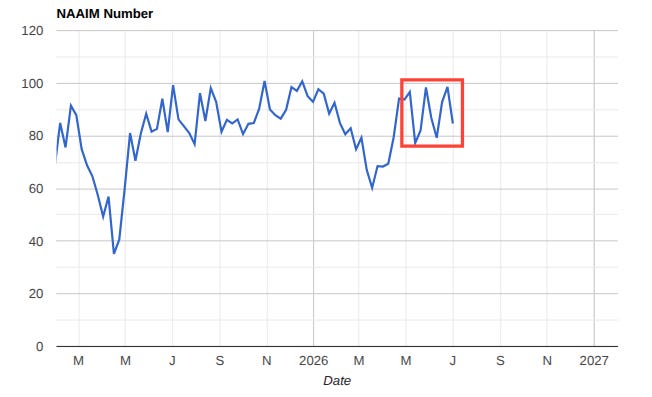
Normally these two chart showing positioning and sentiment are at the end of each Sunday note, today I’m pulling them up to highlight a point. The NAAIM Exposure Index tracks active fund manager positioning to US Equities. Since May, fund managers have been indecisive with positioning, oscillating the portfolio with the market week to week.
While the market trades near all time highs, the wide consolidation and reactionary positioning to single volatile sessions has significantly depressed market sentiment as captured by the CNN Fear & Greed Index.
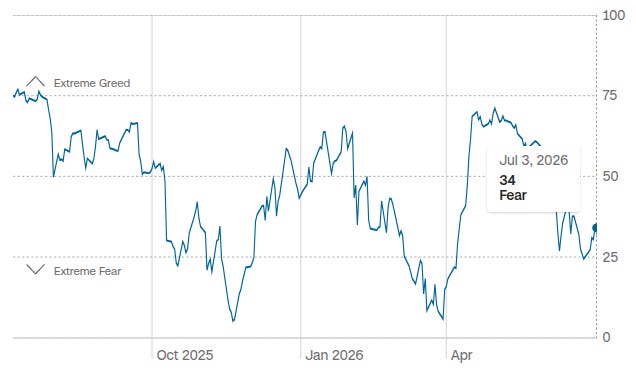
Navigating market chop is not easy, and sentiment being depressed comes as no complete surprise as many participants likely sold on the intraday decline sessions only to reposition when the market reversed course the next day.
It is periods like this were I find an appreciation for the simplicity of the system designed to manage risk and define the market environment. There were moment of caution throughout June, but there was no trigger of an alarm to force a defensive positioning and abandon the long trades. Throughout May and June the weekly letters reinforced “zero bearish consideration until trend, breadth and momentum simultaneously breakdown and trigger a risk-off alarm”
Now, onto the remainder of the weekly analysis.
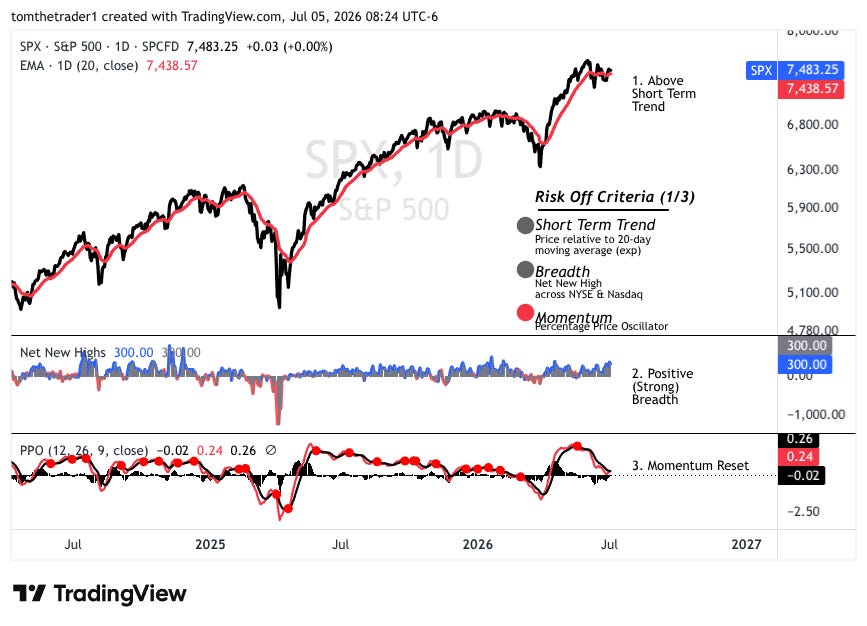
Risk Off Criteria: 1 of 3 Active
The core risk off analysis ended last week reading 1 of 3 active criteria. The index recaptured the short term trend in Monday’s session and held through the remainder of the week. Momentum is nearly reset and any continued consolidation or short term advance will flip this positive clearing the risk off criteria back to zero.
Trend: Price closed above the short term trend (20-day exponential)
Breadth: Positive all week, ending Friday with a strong session
Momentum: Fully reset and approaching a positive crossover
Navigating The Short Term
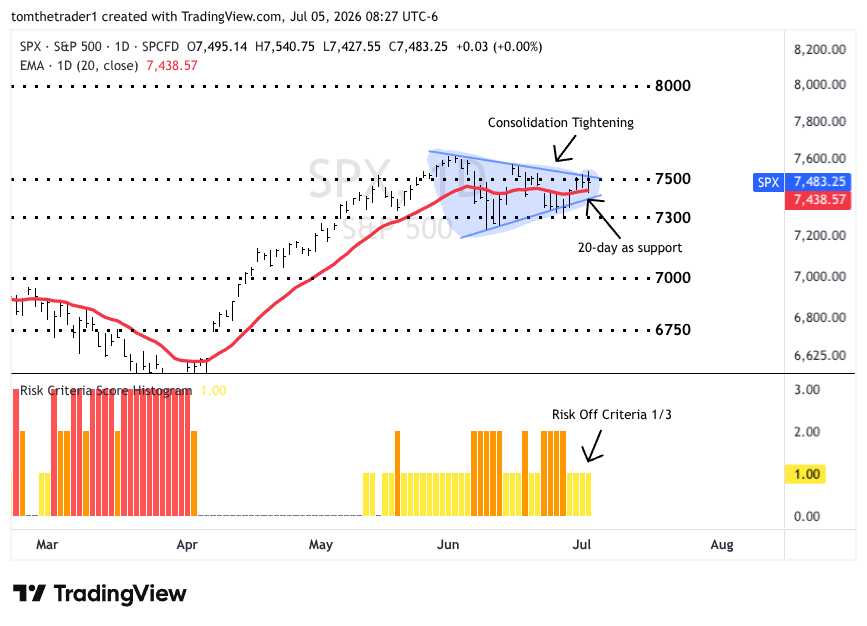
The S&P 500 recaptured the short term trend trading above it on Monday’s session, and thereafter used the remaining 3 sessions in the week finding intraday support at the trendline— this is a positive short term signal.
The consolidation is now clear, it always is in hindsight. The shaded area shows the tightening consolidation from the all time high in June. The lean remains bullish for an upside breakout and advance towards the 8000 psychological target. Downside risk is not wholly absent, but much better risk managed than at any other time through June. With the clear consolidation, a breakdown outside of the wedge, and more importantly below 7300 which has afforded the index critical support through June would mark a change in character.
For now, the plan remains consistent and unchanged:
Maintain bullish above 7438
7300 is afforded the benefit of the doubt as support, conditional on no risk-off alarm being triggered following the loss of the short term trend
Zero bearish thoughts or consideration until a risk-off alarm
Risk On Barometers— ARKK & IWM
ARKK - ARK Innovation ETF
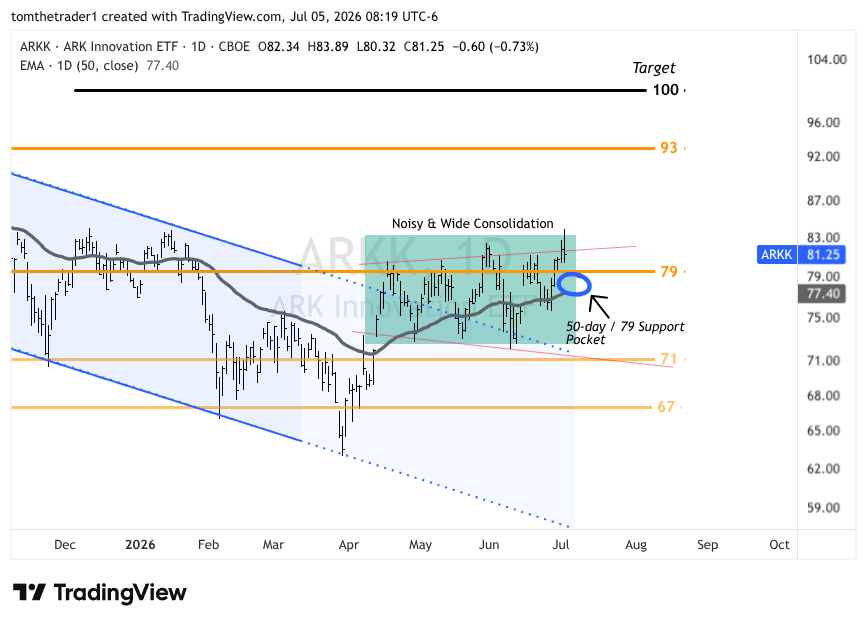
The ARKK trade is now positioned overweight with two consecutive closes above 79.
The chart continues to live inside of the noisy and wide consolidation range that started in April. There now lives a nice support pocket between the 50-day trend and the 79 support level for any intraday volatility.
The plan for ARKK is simple:
Maintain overweight exposure with closing prices above the 50-day trend
Risk manage exposure by 1/2 price close 2X below the 50-day
This plan has created a cycle of full exposure, to half exposure, back to full, to overweight, to full, to overweight over the last several weeks. Since using ARKK as the primary outperformance vehicle in the last two years this has almost become characteristic in establishing positioning. I remain confident that when a sustained advance transpires the 50-day trendline will deliver the support we know exists from historic analysis. The trade will initially target 100, and later 130.
IWM - Russell 2000 ETF
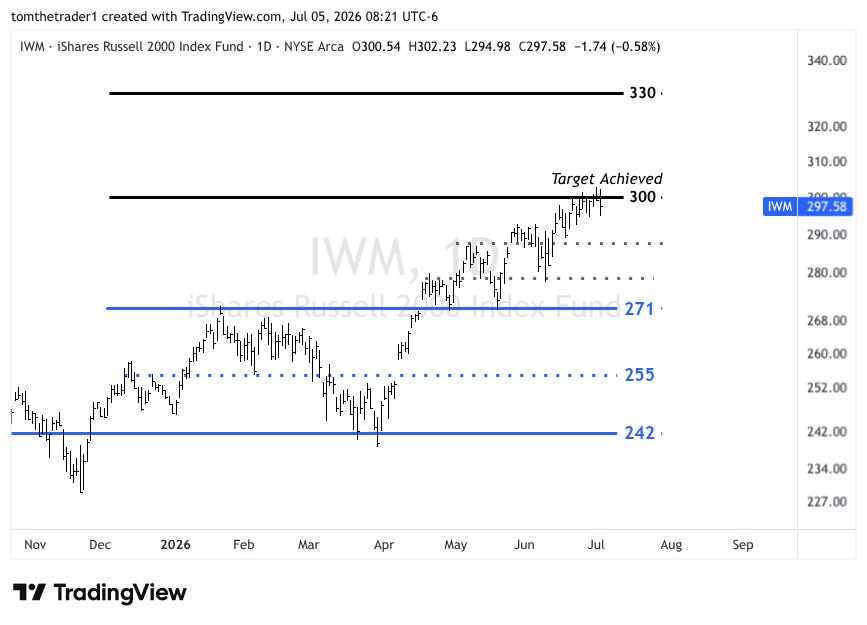
The Russell 2000 ETF IWM trade remains at 1/2 size following profits being collected at the first trade target 300. The remaining positioning targets an advance to 330, or will be risk managed with any closing price below 287. The chart remains in good health.
To balance the bullishness of the overall note today, one could make an argument that the chart is taking the pattern of a rising wedge. If true, the trade will close on a breakdown below 287. That is how simple I am keeping the analysis.
Bonds (20+ Year Treasury Bond)
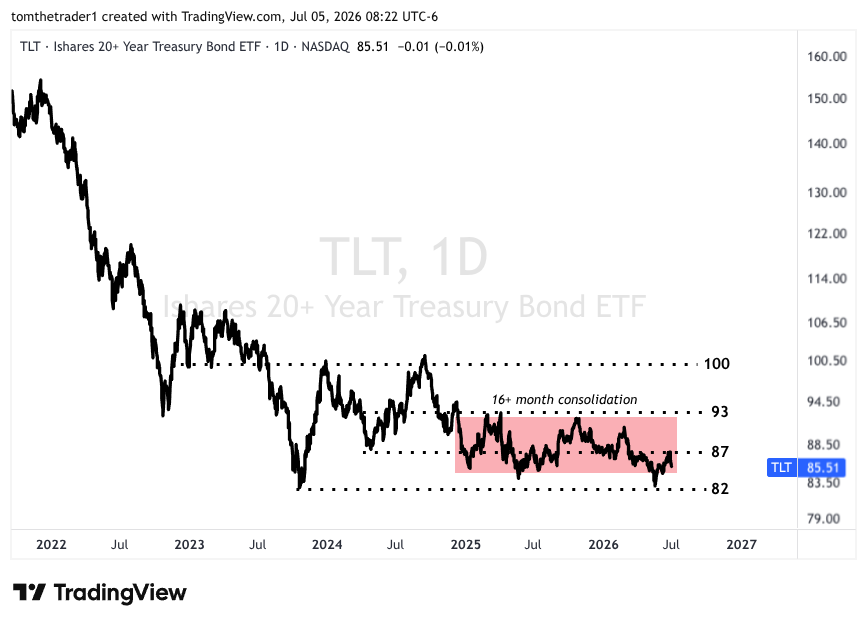
TLT continues to trade inside a very long consolidation box, the analysis on the bond has virtually remained unchanged for a year and half now. A trade that has delivered very little in terms of performance, or defense. The allocation remains at 25%. The only condition I have set here is to reduce to 15% on a breakdown below 82.
Summary Outlook
I intend to keep this simple for as long as possible, the market remains bullish until proven guilty, and until an alarm transpires there is no need for panic, or consideration for defensive positioning.
Enjoy the summer months, and let the system tell me when to change stance.
Strategy Updates— Immediate Term
Key Bullish Criteria:
Shopping Zone: S&P 500 > 7438
Risk-Off Signals: 1 of 3 currently active (momentum).
Risk-On Trade: Long ARKK (overweight exposure, risk manage if 2X below 50-day), Long IWM (1/2 exposure)
Individual Positions: None active. DECK long will trigger with closing prices above 115. GRMN (Garmin) remains a prospect for a trade idea.
Bearish Scenarios:
Bearish Consideration: No consideration until risk-off alarm scenario
Long Bond Exposure: ~25%, reduce to 15% if trade below 82
Disclaimer: This publication is for informational and educational purposes only. Nothing herein should be considered financial advice or a recommendation. I am not a financial advisor. This content is meant to document my thinking, and hopefully encourage yours.