
7/29 Risk Off
The alarm carries on

Lines After Dark
Wednesday Market Update - July 29, 2026
Note, this upcoming Sunday’s newsletter will be delayed to Tuesday August 4. For the first time in many Sunday’s I will be amidst mountains with the hope of no service. Over the years this letter has been written from hotel rooms during travel, family rooms over the holidays, usually service exists. In the hours where I normally write the Sunday letter, I will be traversing through the mountain landscape.
If you did not read last week’s note, you need to. The mantra “bullish until proven guilty” has ended, and the stance shifts.

Onto the regular notes:
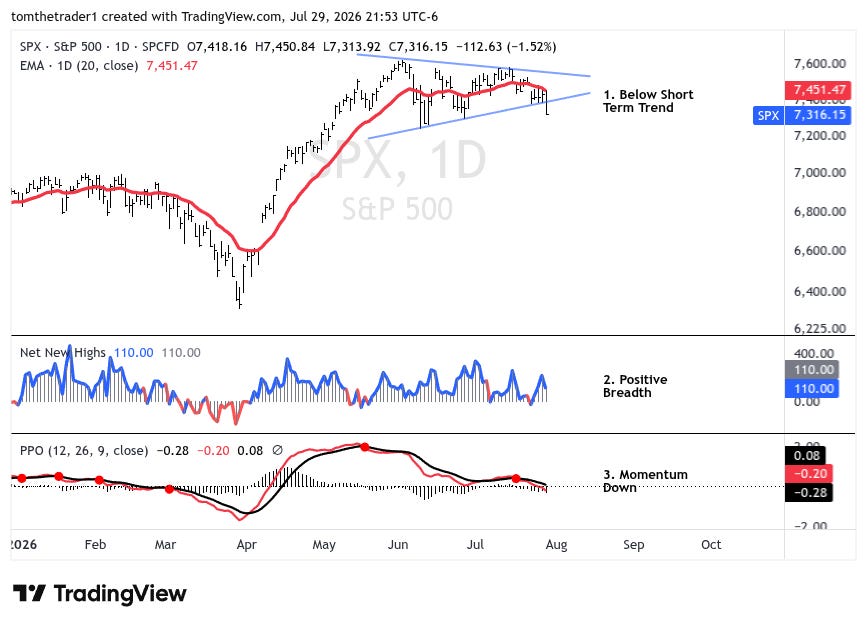
Risk Off Criteria: 2 of 3 Active
The risk off criteria mid week are 2 of 3 with breadth holding positive. The character change towards the short term trend has been consistent, daily intraday rejection right at the trendline. Momentum crossed the zero line. (See March for how that played out earlier this year)
Trend: Price is below the short term trend, consecutive rejections
Breadth: Positive, impressive honestly
Momentum: Negative and below the zero line. Negative breadth will fuel should we flip negative through the remainder of the week
Navigating The Short Term
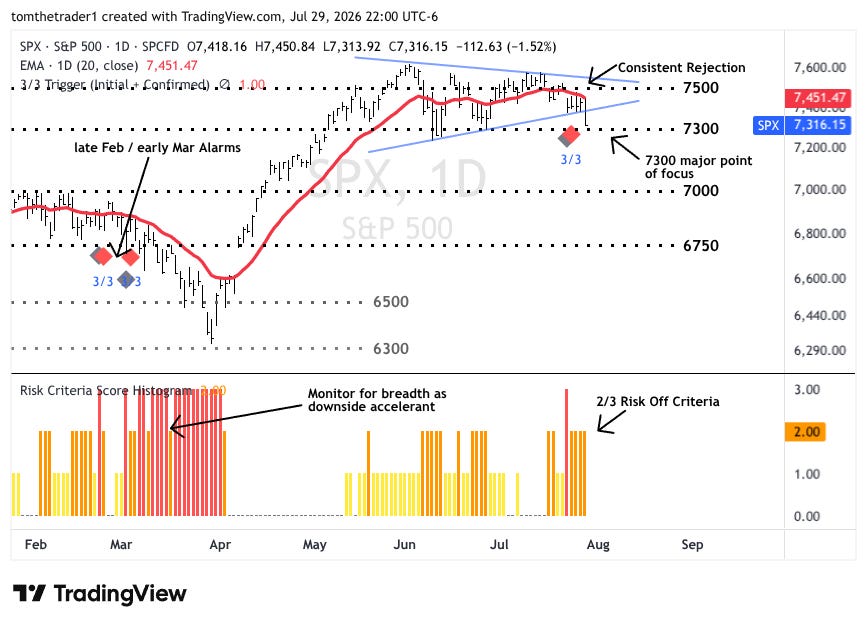
Sunday marked 7300 and 7000 as the main levels to monitor. Price finished Wednesdays trading right there. A breakdown below 7300 creates some bear confidence. Aggressive bear participants probably like this entry, I would prefer to see a slight breakdown and a rejection at 7300 as better risk managed. Small trades, the objective at this stage is to protect capital.
7000 becomes the initial decline target. There is further downside risk in 6750, and I am certain there are market participants drawing up probabilities for the decline to extend to 6300. One step at a time, 7000 and then reevaluate.
Risk On Barometers— ARKK & IWM
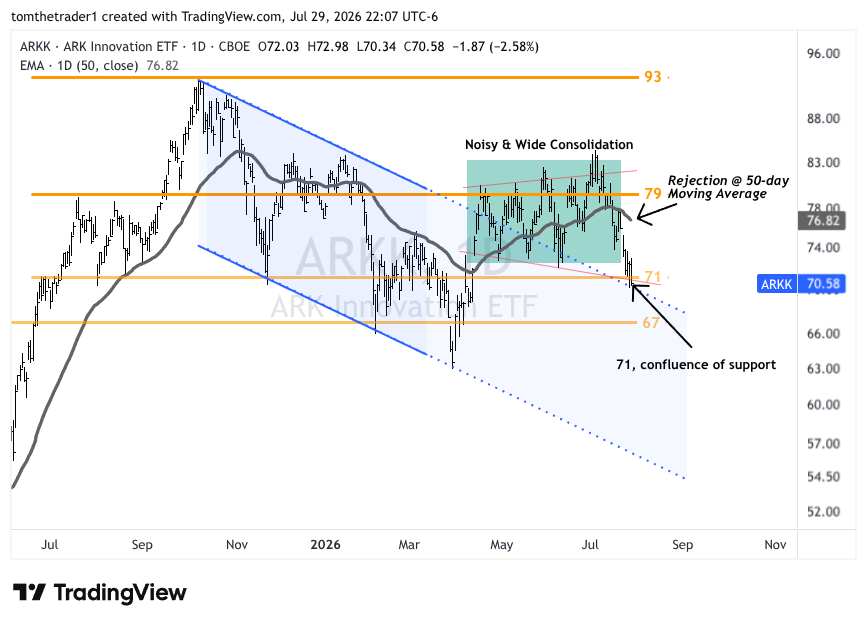
ARKK - ARK Innovation ETF
No change from the outlook from Sunday. ARKK is trading at the 71 support confluence spot. The ARKK chart is difficult to maintain any bullish thoughts when it trades below the 50-day.
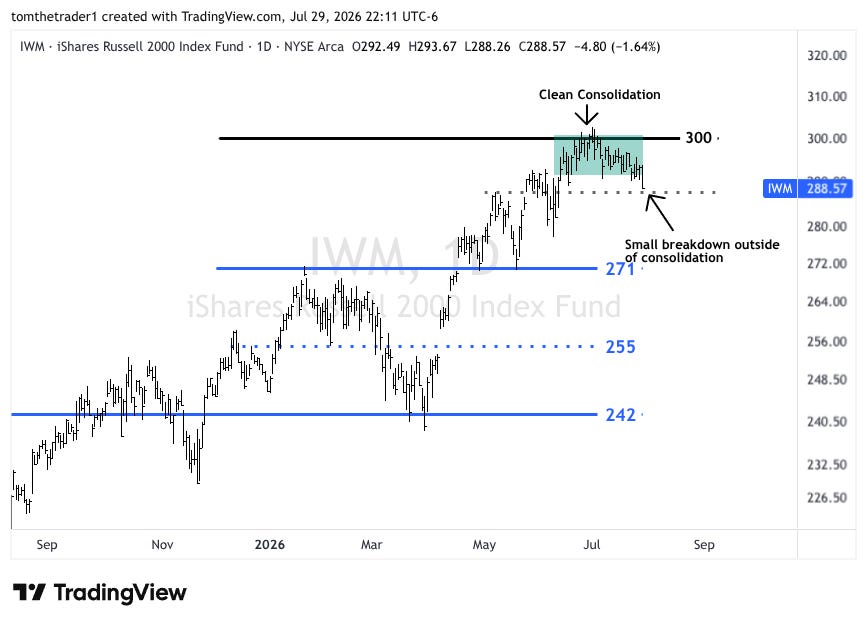
IWM - Russell 2000 ETF
IWM through mid week has stayed outside of the consolidation boundary. For me, this chart doesn’t add to the bearish tone until prices break below 287 and keep there.
Bottom Line
The charts are no better from Sunday for the bullish participant. The mantra of “bullish until proven guilty” was put aside in place of the third market alarm of the year.
7300 is the number to watch for the S&P 500.
Disclaimer: This publication is for informational and educational purposes only. Nothing herein should be considered financial advice or a recommendation. I am not a financial advisor. This content is meant to document my thinking, and hopefully encourage yours.