

When will the market top?
When will the market top?
Correction Criteria Analysis


The Bull Train— When does it stop?
The market closed for another week at record highs. Year-to-date, the S&P 500 has surged by +7.7% and the Nasdaq 100 by +8.8%. Despite historical seasonal odds, February saw the market defy expectations, with brief moments of panic swiftly followed by recoveries. When does the bull train stop?
This week's discussion centers on a review of the technical correction criteria I closely monitor. These criteria will help determine when a correction becomes the next likely market move. I believe that when all three criteria are triggered, it will signal an 8-10% correction in US equities. Given the record rally since November, such a correction presents an opportunity to position for potential short-sided trade.
Newsletter Housekeeping
Before progressing into the charts, a quick update on some newsletter housekeeping. I'm excited to introduce a new feature on Substack—direct messaging. With many subscribers, I've enjoyed exchanging emails for additional context, answering questions, and continuing market discussions. Now, with direct messaging, the Substack inbox is open for even more convenient conversation following the weekly note.
We've successfully wrapped up the second month of Lines On A Chart as a reader-supported publication. I want to extend my thanks for your ongoing readership and for considering my analysis as part of your market study.
Criteria To Signal A Correction
For several weeks now, this newsletter has diligently tracked three correction criteria. While this analysis may seem repetitive, it underscores the importance of signaling a risk-off environment.
The three correction criteria:
Price trades below the short duration moving average (20 day exponential)— signifying the loss of the short term uptrend
Breadth turns negative— more stocks make new lows versus new highs
A concluding momentum interruption
Breadth & Uptrend (1 & 2)
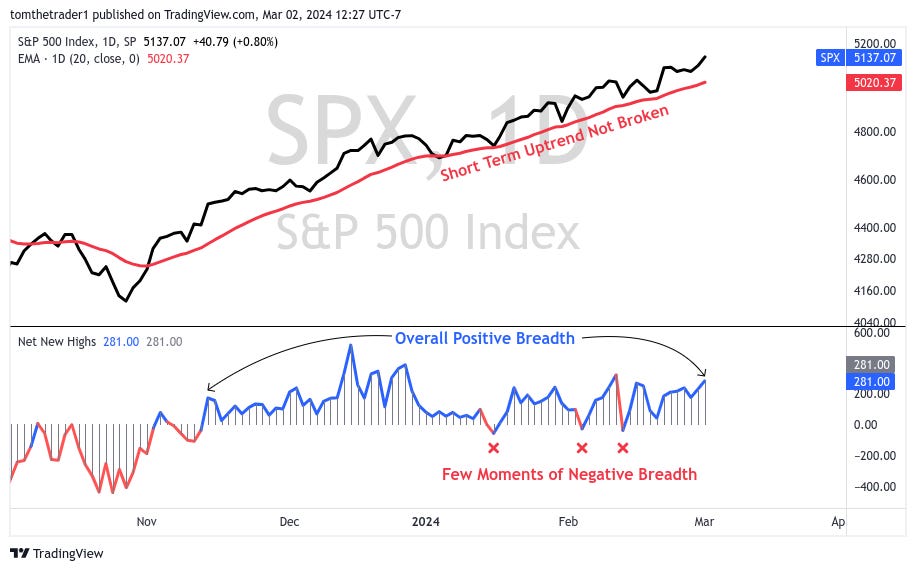
In the S&P 500 chart below, the short-term trend is depicted by the 20-day moving average (exponential) in red, while breadth is shown in the lower panel as Net New Highs, measuring the difference between the number of stocks making new highs versus new lows across NYSE and Nasdaq markets.
Currently, price has consistently remained above the short-term trend, and apart from three isolated instances of negative breadth, more stocks have been making new highs than new lows. Consequently, criteria 1 and 2 remain inactive.
Looking ahead, the key level to watch next week is 5020. A closing price below this mark would signal the initial loss of the uptrend.
Momentum (3)
The third criteria involves assessing momentum disruption. To gauge momentum, I rely on the Price Percentage Oscillator (shown in the lower panel). In my analysis, a momentum disruption can manifest in two primary ways:
An immediate decline following a negative crossover (marked by red dots in lower panel)
Series of momentum interruptions, characterized by a negative crossover in the oscillator not followed by a corrective move in price. Instead, price continues to advance, and the final interruption leads to a decline that erases much or most of the advance during the interruption cycle.
Presently, I observe the market progressing through a series of momentum interruptions. The frequency of these interruptions has increased, with three negative crossovers occurring over the last two weeks.
My speculation remains consistent: upon the final momentum interruption, the corrective move will likely erase the advance, bringing the S&P 500 back to 4550, reflecting an 11.5% decline from Friday’s closing price.

So— When Does The Bull Train Pause / Take Stop?
The Bull Train halts when all three criteria trigger. According to my market analysis, this indicates a high probability of a meaningful correction being the next likely market move.
In the chart below, vertical dotted lines indicate instances where price lost the short-term uptrend, breadth turned negative, and momentum faltered, triggering all three correction criteria.

Unlock every Sunday note and receive out-of-cycle updates whenever key market criteria are triggered, along with trade ideas targeting to capture potential outperformance. Upgrade your subscription today with monthly and annual options available.
Sentiment & Exposure— Complacent Greed
The market has nestled into a complacent greed environment, operating between greed and extreme greed for nearly three and a half months as shown by the CNN Fear & Greed Index.

Active fund managers, as reported by the NAAIM Exposure Index, have maintained elevated exposure to US equities as prices trade at all time highs.

The market uncharacteristically rewarded buyers of greed in December. The chart below highlights the relative peaks in sentiment (CNN Fear & Greed Index) and exposure (NAAIM Exposure Index). Except for December, since the previous market peak in 2022, instances of greed coupled with elevated exposure have typically foreshadowed significant market downturns. I tend to the thought that the December outlier will correct itself and late participants will promptly recall that it is “buy fear, sell greed” and not the other way around.

Next week’s note will include a review of the charts from the three category trade ideas: Small Cap Growth, Outside US Equities, and Gold, which have been earmarked for potential outperformance. It is my thought that these three categories are positioned for outperformance and present appealing trade opportunities amid an index that's currently at all-time highs. Specific to the index— I will however become interested to try again with an index short position upon all three correction criteria becoming active.
Don't forget to explore the new direct message Substack feature. Have a great week ahead!
Disclaimer: The information in this article is for informational purposes only and should not be considered financial advice or a recommendation for any investment. I am not a financial advisor, and the content is not intended to serve as financial advice. It is solely intended to journal thought, ignite more thought and discussion.