

S&P 500: Buy Fear
S&P 500: Buy Fear
Embracing and Capitalizing On Fear


The S&P 500 witnessed an acceleration in the market correction last week, experiencing a decline on four out of five trading days, resulting in a weekly loss of -2.5%. The performance for October to date has been even more challenging, with a cumulative decline of -4%. Despite the consensus and supportive seasonal trend, it failed to materialize.
In my opening letter for October, I shared my anticipation of a scenario where, if the consensus outlook for October were to disappoint, it could potentially lead to a shift in market sentiment towards extreme fear. It seems that moment has arrived.
Severe Correction Confirmed
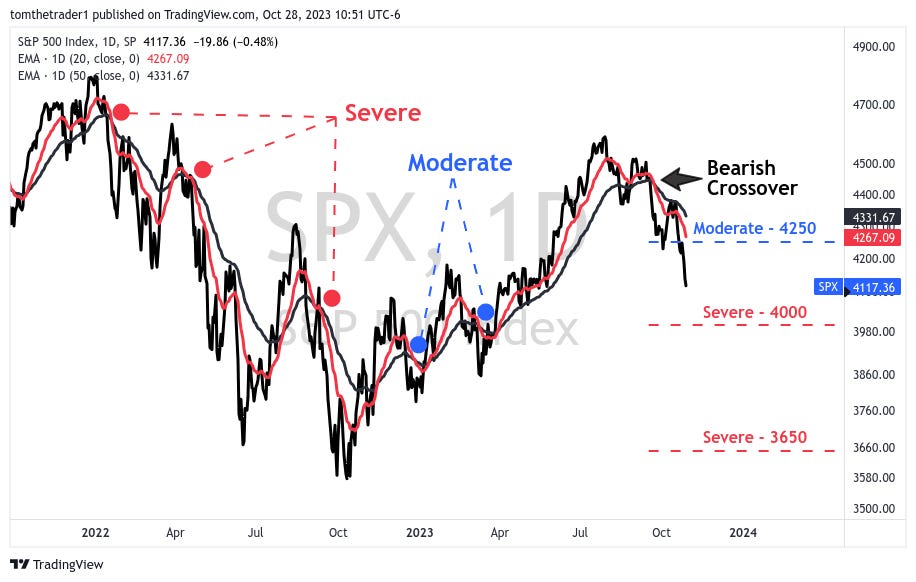
A bearish crossover takes place when the short-term (20-day) moving average crosses below the medium-duration (50-day) moving average, indicating a potential increase in risk. These events are categorized as moderate, indicated by blue dots on the chart below, while red marks signify severe outcomes.
The most recent bearish crossover happened over a month ago. Since then, the focus in this segment of the analysis has been on determining whether a moderate or severe event was more likely. The odds pointed towards a sustained decline, and it is now evident that a severe correction is well underway.
In moderate scenarios, the correction bottom tends to align closely with the crossover
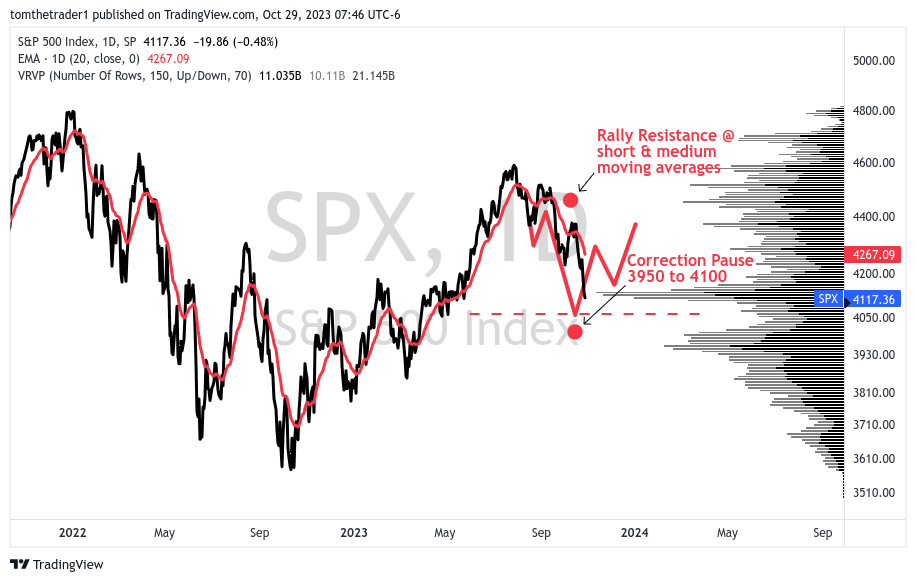
In severe scenarios, the price decline continues and any attempts at a rally find resistance at the short and medium-term moving averages. In 2022, severe events saw declines ranging from 13% to 20%.
Full of Fear
The market as per the CNN Fear & Greed index has operated in a fear based environment for five weeks.

The NAAIM Exposure Index offers insights into the level of exposure to the US equity market among active fund managers. The data from the previous week revealed a lack of conviction in the 'buy the dip' strategy that was in play the week before. Currently, fund managers are holding the lowest level of exposure since October of the previous year. Fear has undeniably set in.

The chart of the S&P 500 below is a combination of sentiment and exposure, highlighting the relative lows of both the CNN Fear & Greed Index (indicated by red arrows) and the NAAIM Exposure Index (shown with blue arrows).
The observation is simple: Over the past two years, whenever sentiment is full of fear and negativity plus fund managers scale back their clients' market exposure, it serves as a clear signal to embrace this fear, often aligning with a significant shift in the market.
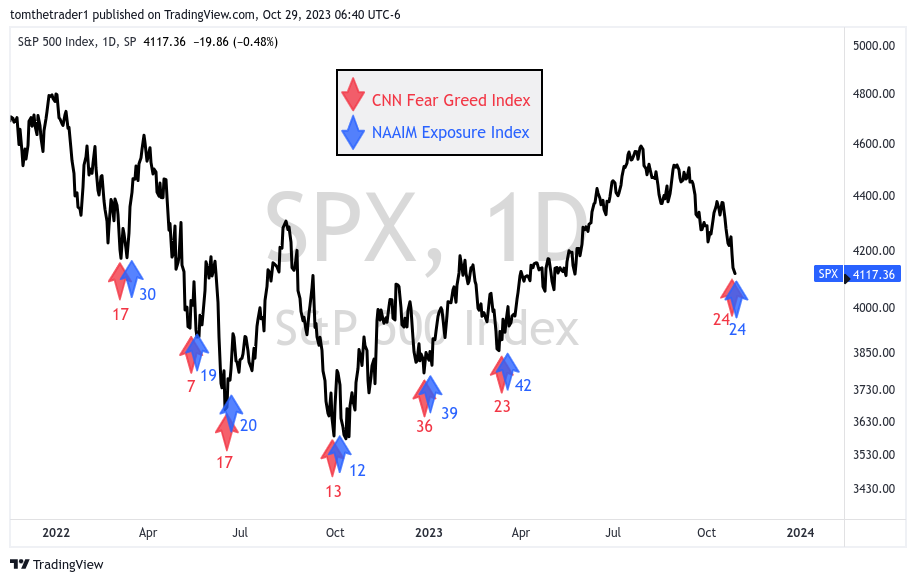
This chart presents a compelling argument for embracing market fear.
The analysis shared here for weeks has pointed to the 3950 - 4100 range as the ideal candidate for a bottom to take shape. Taking into account the current sentiment and exposure data, this range for my portfolio is one to buy fear.
Remember, We’ve Been Here Before
The ongoing correction has the hallmarks of the severe corrections observed in 2022. Relief rallies consistently rejected at the moving averages, and market breadth remains negative.
Market breadth, measured by Net New Highs in the lower panel of the chart, tracks the number of stocks making new lows versus new highs. For the past two months, the market has consistently reported negative breadth each day. Given the current market conditions, I hold a skeptical outlook toward all market rallies, viewing them as temporary relief.
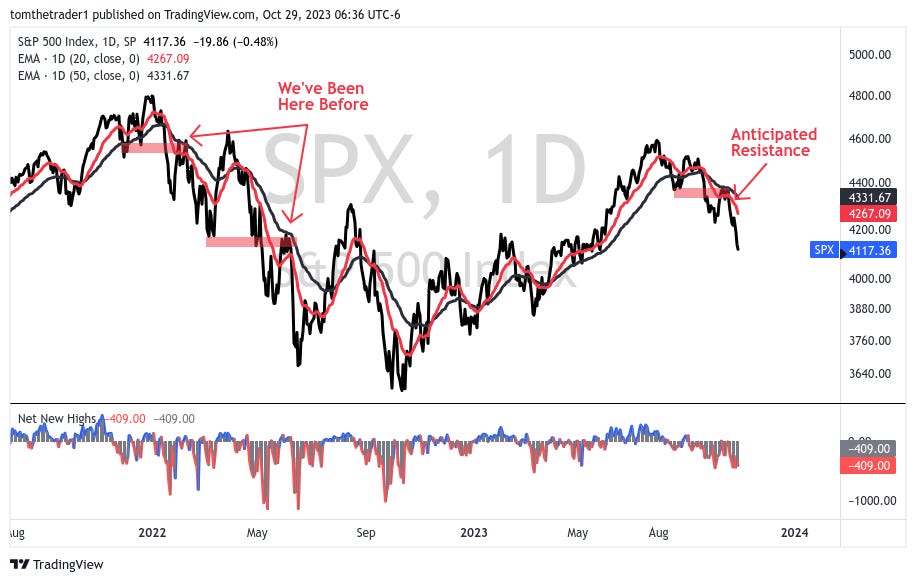
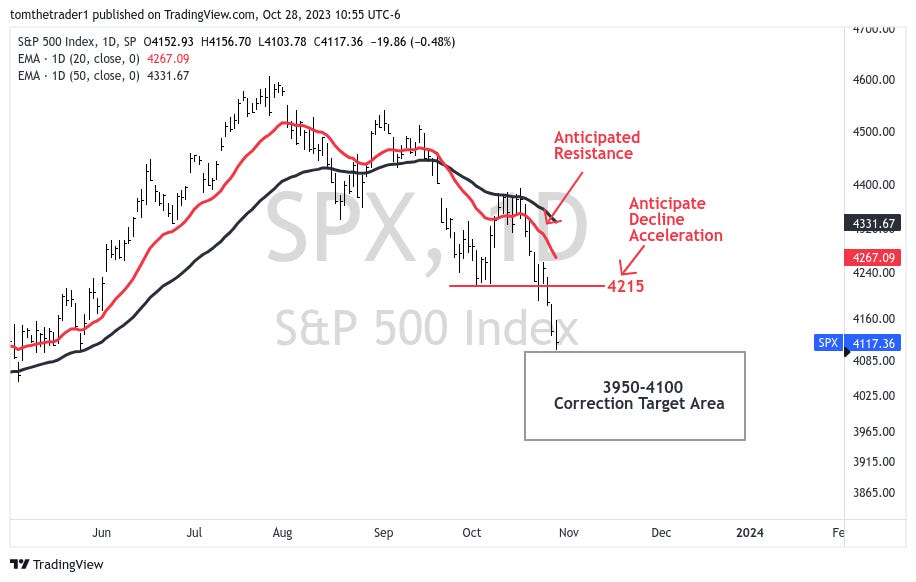
The market decline accelerated as it dropped below the 4215 mark. In my assessment, it is now moving into the final phase of decline, approaching the anticipated correction base within the range of 3950 to 4100. Along the way to the bottom, the preceding chart illustrates sharp relief rallies; however, these rallies tend to encounter resistance at the short-term (20 day) moving average. Interestingly, by next week, this moving average is poised to align with the 4215 level.
Outlook: Correction Bottom
My perspective remains consistent with the previous weeks: The S&P 500 is entering the final phase of its correction with a target range for the bottom range between 3950 - 4100. The index has entered the upper boundary of the range, and the lower boundary represents an additional 4% decline.
The 3950 - 4100 range represents the most transacted area, the area with the highest volume recorded over the last two years, this is illustrated by the peaks in the volume profile on the right side of the chart.
The same area marks horizontal level of prior resistance, in this speculation I am looking for the area to offer support.
For me, this area earns the benefit of the doubt. (In a much more severe correction scenario, prices would decline below 3950— I intend to use this area clearly to manage long exposure risk)
At the bottom, the narrative will be filled with reasons why the market should continue to go down. From my perspective, these are the conditions to embrace fear and avoid becoming paralyzed by it.
In nature as winter arrives bears must hibernate to survive— in a metaphorical sort of way it was first snowfall this past week and with the S&P 500 rapidly declining towards the speculated bottom, it marks a close for my own short trade as a bear participant.
The focus for my own portfolio transitions to buying fear over the coming weeks and ideally through the 3950 - 4100 area.
Reader Supported Publication
I’m excited to announce that Lines On A Chart will soon transform into a reader-supported publication. By pledging now, you can secure founding rates and be part of this exciting evolution. If you’ve found value in this analysis, please share it with your network and join for weekly updates and meaningful market insights.
Disclaimer: The information in this article is for informational purposes only and should not be considered financial advice or a recommendation for any investment. I am not a financial advisor, and the content is not intended to serve as financial advice. It is solely intended to ignite thought and discussion.
Thanks a lot! How are you going to make this trade? Any stop loss?
At 4000 the SPX will have corrected 13%.
At that level RSI and MACD will be very oversold. So I will be watching that level.
Jim